Research Article - (2020) Volume 10, Issue 1
Study of the Association between Amplitude of Alpha Oscillations at Rest and Scores on the Intellectual Style Inventory
- Corresponding Author:
- Mai S Saleh
Department of Environmental and Occupational Medicine
National Research Centre, Dokki, Giza, Egypt
E-mail: [email protected]
Abstract
ABSTRACT
The Intellectual style inventory (ISI) is a tool for learning style assessment after cortical functional specialization. It introduces four perception styles and four thinking styles that are functionally rooted at the four brain cortical lobes. Alpha activity detected by EEG at rest is known to associate intrinsic neural patterns that differ from one person to another.
Aim: The present work aimed to investigate the association between the activities of alpha wave at rest at different brain regions and between the scores obtained by the ISI regarding the different thinking and perception style.
Methods: Participants included in the study reached 36 neurologically healthy females, 16 years of age, and at the same education level. All participants completed the ISI with EEG recording amplitude of alpha oscillations at rest with closed eyes in 19 electrode sites
according to 10-20 international system.
Results: Significant negative correlations were detected between amplitude of alpha oscillations and scores on the ISI at the different brain regions with lower mean for the groups showing higher scores on the ISI for the front thinking styles and the base perception styles.
Conclusion: The ISI is able to introduce a promising conceptual frame and applicable tool for comprehensive investigation of neural patterns relevant to cognitive tasks eminent to psychological functions of learning and information processing.
Keywords
ISI, EEG, Alpha oscillation at rest, Cortical functional specialization, Concept learning, Brain regions
Introduction
The Intellectual Style Inventory (ISI) [1] is a learning style assessment tool that gathers between the most convenient and popular learning style theories and models in a new powerful and indicative construct. The ISI is able to identify four different styles of thinking that describe psychological functions of problem solving and decision making and four different styles in perception differentiating learners according to their preferential way in perceiving the world and encoding inputs. Thinking and perception integrate for concept formation using the different memory systems [2]. Three languages of thought (visual, verbal and emotional) build corresponding image schemas (semantic and descriptive) that are stored in the perceptual representation system to build the Gestalt [3]. A software program was developed for the ISI using artificial intelligence potentials to facilitate its use in the field of research [4].
The ISI, according to law of preference, assumes that each learner possesses the four styles of thinking but with different degrees and similarly, for the four perception styles. Functionally, the ISI depends on the concept of cortical specialization and proposes that each of the four thinking styles (TS) is rooted at one of the four cortical lobes of the brain. The four perception styles (PS) are also rooted at the same four cortical lobes yet different psychological functions perform their learning tasks.
According to recent research [5], it became evident that resting state neuronal activity, recorded by EEG, associate persistent activity patterns that aren’t stimulus-induced. Consequently, it is hypothesized to find different and distinctive intrinsic activity patterns upon analysis of brain dynamics that are characteristic to the different intellectual styles in perception and thinking that could be associated with their scores on the ISI.
Particularly alpha EEG oscillatory activity proved to show functional significance and has been noticed to associate –in terms of amplitude/ power- basic and complex cognitive processes whether task related or at rest [6].
Hence, in an attempt to generate a neurophysiological model for the different thinking and perception styles assessed by the ISI, a study was performed to investigate the association between the powers of alpha wave at rest at different brain regions and between the scores obtained by the ISI regarding the different thinking and perception styles.
Subjects and Methods
Participants included in the study reached 36 neurologically healthy females, 16 years of age, and at the same education level (completed their high school degree). They were asked to complete the 48 sentences questionnaire of the ISI by grading each sentence with a score within a 5 Likert scale starting by 5 for “Strongly matching” and ending by the score of 1 that corresponded to “never matching”. Total score for each style (represented by 6 separate sentences) ranged from 30 as highest score and 6 as lowest one [1].
Participants were subjected to EEG assessment during resting condition for 30 minutes while lying comfortably on bed. The EEG was recorded using EBNeuro Galileo NT, PMS USA machine (serial number: DAUNL7HQNUSFG, model: Mizar. 8351037899, and version 3.61) at the Clinical Neurophysiology Unit, kasr El Ainy Hospital, Cairo University. The sensitivity was set at 70 μv /cm with low-frequency filters 0.3 Hz, high-frequency filter 30 Hz and 50-Hz notch filter.
Quantitative EEG measurements were obtained over the standard 19 locations. After completion of the testing-using Win EEG software- Epochs of the filtered electroencephalogram from excessive amplitude (>100 μV) and/or excessively fast (>35 μV in 20 to 35Hz band) and slow (>50 μV in 0 to 1 Hz band) frequency activities was automatically marked and excluded. The power spectrum was computed by means of “fast Fourier transformation”.
Absolute power in μv² was computed for Alpha (8–13 Hz) band in 19 electrode sites according to 10-20 international system. Finally, the absolute powers from the 19 electrodes was averaged for the following eight regions: Left frontal region (F3), Right frontal region ( F4), Left temporal region (T3 ), Right temporal region (T4), Left parietal region (P3), Right parietal region (P4), Left occipital region (O1) and Right occipital region (O2). Topographic maps demonstrating the mean absolute powers of alpha of subjects were performed.
Statistical Package for the Social Sciences (SPSS) 23.0 (SPSS Inc., Chicago, IL, USA) was used for descriptive tests, comparing means (student t-test) and Pearson correlation test.
Results
Upon analysis of data percentages of participants obtaining 80% or more in the four PS; front left perception (FLp), front right perception (FRp), base right perception (BRp) and base left perception (BLp) were 75%, 47.2%, 52.8% and 91.7%, respectively. Yet, percentages for TS scores -equal to or exceeding 24 points (80%)- were 75% for front left thinking style (FLt), 58.3% for front right (FRt), 72.2% for base right (BRt) and 30.6% for base left thinking style (BLt).
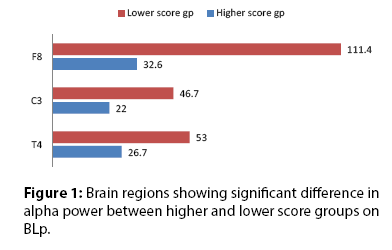
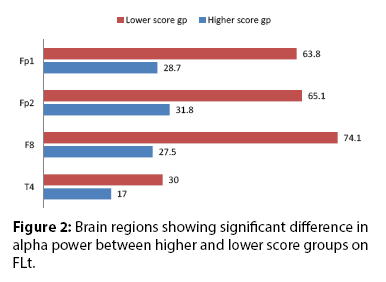
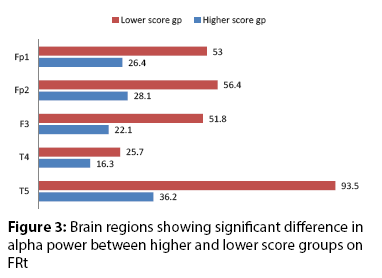
Mean values for perception styles scores were 25, 23, 24 and 27 for FLp, FRp, BRp and BLp, respectively and 26 for FLt, 24 for FRt, 25 for BRt and 22 for BLt. A cut off value of 24 was taken to create two groups regarding each thinking and perception style; a high score group (≥ 24) and a low score group (<24). Power of alpha oscillation at rest (mean values) when compared between the two groups revealed significant differences at some brain regions (Tables 1-3, Figures 1-3).
| Fp1 | Fp2 | F3 | F7 | Fz | F4 | F8 | |
|---|---|---|---|---|---|---|---|
| FLp ≥ 24 <24 |
38.3 ± 39.5 34.9 ± 29.1 |
39.3 ± 39.7 39.7 ± 32.1 |
34.9 ± 36.5 33.4 ± 38.8 |
30.1 ± 27.5 29.1 ± 23.3 |
38.7 ± 43.4 40.7 ± 43.2 |
56.5 ± 133.2 49.2 ± 63.1 |
43.4 ± 45.9 26.4 ± 21.9 |
| FRp ≥ 24 <24 |
35.9 ± 40.7 38.8 ± 34.0 |
38.4 ± 42.1 40.4 ± 33.6 |
32.2 ± 34.8 36.6 ± 38.8 |
27.3 ± 26.0 32.4 ± 27.0 |
38.3 ± 41.3 40.0 ± 45.1 |
34.7 ± 43.9 72.6 ± 158.1 |
39.0 ± 39.3 39.2 ± 44.6 |
| BRp ≥ 24 <24 |
31.1 ± 27.0 44.6 ± 45.2 |
34.0 ± 27.0 45.8 ± 47.2 |
27.2 ± 21.0 42.6 ± 47.8 |
27.9 ± 24.5 32.3 ± 28.9 |
32.7 ± 20.4 46.4 ± 58.6 |
34.2 ± 41.5 77.6 ± 166.9 |
26.7 ± 21.5 53.0 ± 53.6 |
| BLp ≥ 24 <24 |
35.4 ± 37.8 60.0 ± 7.7 |
37.7 ± 37.9 66.9 ± 6.1 |
32.2 ± 37.0 60.4 ± 18.6 |
28.5 ± 26.5 51.2 ± 1.1 |
38.9 ± 44.6 43.6 ± 9.8 |
33.2 ± 41.8 291.3 ± 356.6 |
32.6 ± 33.3* 111.4 ± 62.2* |
| FLt ≥ 24 <24 |
28.7 ± 27.9* 63.8 ± 48.7* |
31.8 ± 29.2* 65.1 ± 51.7* |
25.9 ± 27.8 60.3 ± 48.1 |
25.3 ± 23.9 44.5 ± 29.8 |
30.8 ± 29.7 64.2 ± 64.8 |
24.6 ± 23.3 144.9 ± 218.4 |
27.5 ± 28.3* 74.1 ± 55.6* |
| FRt ≥ 24 <24 |
26.4 ± 26.5* 53.0 ± 44.1* |
28.1 ± 26.8* 56.4 ± 45.2* |
22.1 ± 20.9* 51.8 ± 46.4* |
24.9 ± 23.9 36.9 ± 28.6 |
25.8 ± 19.8 57.9 ± 58.0 |
28.3 ± 40.3 91.6 ± 174.4 |
28.1 ± 30.2 54.6 ± 50.8 |
| BRt ≥ 24 <24 |
39.6 ± 41.9 31.9 ± 18.3 |
40.7 ± 42.7 36.1 ± 20.2 |
38.2 ± 41.4 25.0 ± 16.9 |
31.9 ± 29.0 24.9 ± 18.1 |
43.2 ± 49.2 28.9 ± 15.2 |
57.4 ± 135.9 47.6 ± 58.6 |
38.6 ± 38.0 40.5 ± 52.1 |
| BLt ≥ 24 <24 |
37.6 ± 32.4 37.4 ± 39.2 |
40.3 ± 32.2 39.0 ± 40.3 |
32.0 ± 24.8 35.6 ± 41.1 |
34.0 ± 28.2 27.9 ± 25.6 |
34.9 ± 22.0 41.1 ± 49.5 |
41.8 ± 52.7 60.3 ± 138.9 |
43.4 ± 35.4 37.9 ± 44.5 |
*significant at p<0.05, **highly significant at p<0.01
Table 1: Compared means of Absolute alpha power oscillation between high score and low score groups on the four styles of perception and thinking of the ISI in the fronto-polar and frontal brain regions.
| T3 | C3 | Cz | C4 | T4 | T5 | T6 | |
|---|---|---|---|---|---|---|---|
| FLp ≥ 24 <24 |
18.9 ± 13.8 24.6 ± 28.6 |
24.6 ± 21.2 22.9 ± 20.9 |
26.5 ± 30.0 37.4 ± 47.2 |
19.2 ± 17.0 23.9 ± 23.3 |
21.0 ± 14.3 18.6 ± 13.9 |
61.3 ± 72.3 56.3 ± 70.5 |
53.4 ± 40.5 48.2 ± 34.2 |
| FRp ≥ 24 <24 |
16.4 ± 10.3 23.8 ± 23.0 |
21.8 ± 18.6 26.1 ± 22.8 |
26.4 ± 26.1 31.7 ± 41.4 |
18.7 ± 15.1 21.8 ± 21.4 |
20.4 ± 14.5 20.3 ± 14.0 |
56.9 ± 76.6 62.9 ± 67.3 |
55.8 ± 40.3 48.6 ± 37.7 |
| BRp ≥ 24 <24 |
18.3 ± 13.3 22.6 ± 22.9 |
24.5 ± 21.1 23.7 ± 21.1 |
23.2 ± 16.9 35.9 ± 47.0 |
18.1 ± 13.7 22.9 ± 23.0 |
19.7 ± 10.2 21.0 ± 17.5 |
45.5 ± 33.3 76.4 ± 95.9 |
55.6 ± 34.5 47.9 ± 43.3 |
| BLp ≥ 24 <24 |
19.5 ± 18.7 29.9 ± 11.4 |
22.0 ± 18.9* 46.7 ± 31.4 |
28.7 ± 36.0 35.1 ± 16.1 |
19.6 ± 18.9 28.512.4 |
18.9 ± 13.3* 36.1 ± 14.5* |
57.7 ± 73.0 86.1 ± 36.9 |
52.2 ± 39.3 49.0 ± 33.0 |
| FLt ≥ 24 <24 |
18.5 ± 19.3 25.9 ± 14.7 |
22.4 ± 20.4 30.2 ± 22.6 |
23.7 ± 29.8 45.8 ± 44.1 |
17.7 ± 17.2 28.3 ± 21.1 |
17.0 ± 10.6* 30.0 ± 18.5* |
45.0 ± 47.9 105.3 ± 106.9 |
52.1 ± 39.9 51.7 ± 36.3 |
| FRt ≥ 24 <24 |
14.8 ± 11.8 28.1 ± 23.0 |
21.3 ± 19.2 28.4 ± 23.1 |
18.9 ± 15.8 43.6 ± 47.5 |
14.9 ± 11.6 28.0 ± 23.6 |
16.3 ± 10.9* 25.7 ± 16.9* |
36.2 ± 30.0* 93.5 ± 96.0* |
42.7 ± 32.5 65.3 ± 43.6 |
| BRt ≥ 24 <24 |
21.3 ± 20.7 17.7 ± 10.4 |
26.4 ± 23.4 18.6 ± 11.3 |
33.7 ± 39.5 17.4 ± 10.9 |
22.1 ± 20.5 15.8 ± 11.6 |
21.0 ± 15.4 18.7 ± 10.1 |
67.0 ± 80.6 42.0 ± 31.0 |
55.5 ± 42.2 43.7 ± 28.1 |
| BLt ≥ 24 <24 |
18.9 ± 14.3 21.0 ± 20.1 |
26.7 ± 24.1 23.0 ± 19.6 |
25.9 ± 18.9 30.7 ± 39.9 |
18.9 ± 13.1 21.0 ± 20.7 |
19.8 ± 8.8 20.6 ± 15.8 |
48.7 ± 35.5 65.1 ± 81.9 |
57.8 ± 37.8 49.6 ± 39.4 |
Table 2: Compared means of absolute alpha power oscillation between high score and low score groups on the four styles of perception and thinking of the ISI in the temporal and central brain regions.
| P3 | Pz | P4 | O1 | O2 | |
|---|---|---|---|---|---|
| FLp ≥ 24 <24 |
44.0 ± 45.7 38.4 ± 34.4 |
83.0 ± 173.1 39.2 ± 39.1 |
60.1 ± 67.7 42.0 ± 44.7 |
151.5 ± 194.7 270 ± 322.2 |
168.5 ± 154.6 156.4 ± 168.2 |
| FRp ≥ 24 <24 |
37.4 ± 35.8 47.0 ± 48.2 |
45.7 ± 46.2 95.5 ± 203.8 |
59.4 ± 69.8 52.1 ± 57.2 |
129.6 ± 147.3 227.6 ± 286.6 |
152.2 ± 129.6 176.4 ± 175.1 |
| BRp ≥ 24 <24 |
38.8 ± 34.7 47.2 ± 51.4 |
45.4 ± 49.5 101.8 ± 213.8 |
48.2 ± 45.2 63.8 ± 78.5 |
180.5 ± 198.4 182.2 ± 274.3 |
165.4 ± 133.9 166.4 ± 183.9 |
| BLp ≥ 24 <24 |
42.1 ± 43.7 48.6 ± 36.3 |
47.2 ± 53.7 345.2 ± 483.4 |
53.6 ± 64.2 77.0 ± 45.1 |
167.5 ± 226.1 334 ± 316.5 |
152.8 ± 150.0 292.3 ± 175.6 |
| FLt ≥ 24 <24 |
36.5 ± 36.5 63.2 ± 57.3 |
39.6 ± 47.0 169.2 ± 281.4 |
44.4 ± 50.4 88.9 ± 85.2 |
154.4 ± 233.8 262 ± 227.3 |
129.5 ± 113.5 274.9 ± 214.2 |
| FRt ≥ 24 <24 |
32.9 ± 30.0 57.2 ± 54.7 |
34.8 ± 45.9 124.2 ± 222.3 |
39.6 ± 45.5 77.9 ± 77.1 |
151.9 ± 189.6 222.5 ± 286.9 |
135.1 ± 126.1 210.7 ± 185.8 |
| BRt ≥ 24 <24 |
47.6 ± 48.1 30.2 ± 21.7 |
84.8 ± 177.0 38.9 ± 25.8 |
63.2 ± 72.0 35.8 ± 16.8 |
181.3 ± 240.7 181.4 ± 227.1 |
161.0 ± 155.0 176.5 ± 162.5 |
| BLt ≥ 24 <24 |
43.2 ± 37.6 42.3 ± 45.6 |
51.7 ± 58.8 81.0 ± 178.3 |
56.8 ± 56.2 55.0 ± 66.4 |
230.3 ± 234.2 159.8 ± 235.1 |
184.9 ± 150.8 157.20 ± 159.5 |
Table 3: Compared means of absolute alpha power oscillation between high score and low score groups on the four styles of perception and thinking of the ISI in the parietal and occipital brain regions.
Remarkably, findings revealed that mean values of absolute alpha power in both higher and lower score groups for FLp and FRp styles were nearly equal showing no significant differences while lower score group showed higher mean values for absolute alpha power in all brain regions in BRp and BLp styles with significant differences in F8, C3 and T4 electrode sites concerning the latter. On the contrary, mean values for absolute alpha power in both higher and lower score groups for BRt and BLt styles were nearly equal or slightly higher for the higher score group with no significant differences while lower score group showed higher mean values for absolute alpha power for all brain regions in FLt and FRt styles with significant differences in Fp1, Fp2, F8 and T4, for the former and Fp1, Fp2, F3, T4 and T5 for the latter.
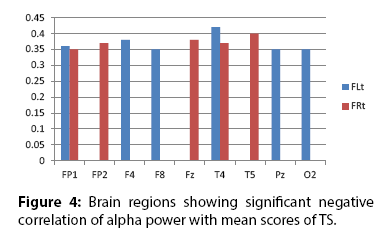
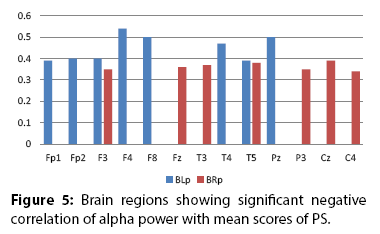
Significant negative correlations were also detected between power means for alpha oscillations and scores on the ISI at the different brain regions as detailed in Tables 4-6, Figures 4 and 5.
| FLp | FRp | BRp | BLp | FLt | FRt | BRt | BLt | |
|---|---|---|---|---|---|---|---|---|
| Fp1 r p |
0.033 0.848 |
-0.029 0.865 |
-0.329 0.05 |
-0.388* 0.019 |
-0.335* 0.034 |
-0.349* 0.037 |
0.064 0.712 |
0.165 0.337 |
| Fp2 r p |
0.016 0.926 |
-0.025 0.888 |
-0.328 0.054 |
-0.403* 0.016 |
-0.308 0.072 |
-0.369* 0.029 |
0.051 0.772 |
0.188 0.279 |
| F3 r p |
0.008 0.965 |
-0.025 0.885 |
-0.35* 0.037 |
-0.41* 0.013 |
-0.297 0.078 |
-0.377* 0.023 |
0.097 0.576 |
0.129 0.455 |
| F7 r p |
0.06 0.736 |
-0.047 0.79 |
-0.305 0.08 |
-0.32 0.065 |
-0.271 0.121 |
-0.254 0.147 |
0.069 0.699 |
0.219 0.212 |
| Fz r p |
0.004 0.982 |
-0.019 0.912 |
-0.363* 0.029 |
-0.305 0.07 |
-0.239 0.16 |
-0.334* 0.046 |
0.115 0.505 |
0.145 0.399 |
| F4 r p |
-0.112 0.514 |
-0.049 0.779 |
-0.201 0.24 |
-0.538** 0.001 |
-0.384* 0.021 |
-0.276 0.103 |
-0.160 0.35 |
-0.168 0.329 |
| F8 r p |
0.179 0.295 |
0.06 0.73 |
-0.164 0.34 |
-0.498** 0.002 |
-0.348* 0.038 |
-0.202 0.238 |
-0.016 0.925 |
0.074 0.666 |
* Correlation is significant at the 0.05 level (2-tailed).
** Correlation is significant at the 0.01 level (2-tailed).
Table 4: Bivariate correlations between the four styles of perception and thinking and the fronto-polar and frontal brain regions.
| FLp | FRp | BRp | BLp | FLt | FRt | BRt | BLt | |
|---|---|---|---|---|---|---|---|---|
| T3 r p |
-0.97 0.572 |
-0.095 0.582 |
-0.366* 0.028 |
-0.309 0.067 |
-0.13 0.45 |
-0.277 0.102 |
0.008 0.961 |
0.073 0.674 |
| C3 r p |
-0.039 0.825 |
0.101 0.563 |
-0.003 0.987 |
-0.292 0.089 |
-0.17 0.33 |
-0.151 0.387 |
0.075 0.668 |
0.092 0.601 |
| Cz r p |
-0.068 0.692 |
-0.043 0.803 |
-0.389* 0.019 |
-0.268 0.114 |
-0.16 0.352 |
0.319 0.058 |
0.125 0.469 |
0.137 0.424 |
| C4 r p |
-0.041 0.812 |
-0.07 0.684 |
-0.342* 0.041 |
-0.311 0.065 |
0.14 0.415 |
-0.259 0.127 |
0.122 0.479 |
0.122 0.479 |
| T4 r p |
-0.058 0.743 |
0.028 0.872 |
-0.27 0.117 |
-0.469** 0.004 |
-0.417* 0.013 |
-0.373* 0.027 |
-0.037 0.831 |
-0.031 0.858 |
| T5 r p |
0.025 0.883 |
-0.074 0.667 |
-0.379* 0.022 |
-0.385* 0.02 |
-0.318 0.059 |
-0.399* 0.016 |
0.119 0.491 |
0.77 0.656 |
| T6 r p |
0.129 0.467 |
0.224 0.204 |
-0.09 0.611 |
-0.065 0.713 |
0.056 0.755 |
-0.265 0.131 |
0.024 0.893 |
0.278 0.111 |
* Correlation is significant at the 0.05 level (2-tailed).
** Correlation is significant at the 0.01 level (2-tailed).
Table 5: Bivariate correlations between the four styles of perception and thinking and the temporal and central brain regions.
| FLp | FRp | BRp | BLp | FLt | FRt | BRt | BLt | |
|---|---|---|---|---|---|---|---|---|
| P3 r p |
0.166 0.34 |
-0.082 0.639 |
-0.352* 0.038 |
-0.21 0.226 |
-0.157 0.367 |
-0.145 0.406 |
-0.009 0.958 |
0.146 0.403 |
| Pz r p |
-0.027 0.876 |
-0.042 0.807 |
-0.149 0.384 |
-0.501** 0.002 |
-0.348* 0.037 |
-0.322 0.055 |
-0.05 0.772 |
-0.154 0.371 |
| P4 r p |
0.06 0.729 |
0.112 0.517 |
-0.194 0.258 |
-0.3 0.075 |
-0.239 0.161 |
-0.305 0.07 |
0.134 0.436 |
0.187 0.276 |
| O1 r p |
-0.116 0.499 |
-0.119 0.491 |
-0.269 0.113 |
-0.235 0.167 |
-0.093 0.591 |
-0.134 0.437 |
-0.062 0.719 |
0.205 0.23 |
| O2 r p |
0.093 0.614 |
-0.086 0.641 |
-0.349 0.05 |
-0.302 0.093 |
0.353* 0.0484 |
-0.112 0.54 |
-0.233 0.198 |
0.073 0.692 |
* Correlation is significant at the 0.05 level (2-tailed).
** Correlation is significant at the 0.01 level (2-tailed).
Table 6: Bivariate correlations between the four styles of perception and thinking and the parietal and occipital brain regions.
Discussion and Conclusion
Functional specialization within the association cortex and significance of alpha activity at rest are hot topics that gained extensive research yet, with elusive outcomes. The present work is an attempt to gain the privilege of the obtained findings regarding both of the aforementioned phenomena–found in literature- to improve the understanding of the functional and neurophysiological features of the perception and thinking styles introduce by the ISI.
Upon analysis of the obtained results from the present work, clear patterns were obtained showing prominent association between alpha amplitude at rest and scores on the ISI styles. As reported, alpha power activity is stable and unique for each individual [7] with higher amplitude/power indicating lower metabolic activity in the cortex and vice versa [8]. Hence, it could be suggested that the fronto-polar regions (Fp1 & Fp2) could perfectly describe functions of the FL and FR thinking styles since they showed significant lower absolute alpha power among the higher score groups. Such findings could be supported by previous studies that revealed responsibility of fronto-polar regions for prospective memory and future thinking [9], facing uncertainty and conflict [10] and cognitive branching [11] functions eminent to FRt style and exploratory decision making [12] and evaluating counterfactual choices [13] characterizing the FLt style.
According to literature, it is sought that temporal brain regions are involved in episodic memory [14]. As revealed by the present study, significant negative correlation was detected between absolute alpha power and ISI scores on the BRp at T3 where the higher score group showed lower alpha power. As per the Integrated Model of Mind (IMM) [2], the episodic memory is the long term memory denoted for encoding processes performed by the BRp style. Similarly, [15] in their working memory (WM) model suggested a frontal-parietal-medial-temporal network as a neural correlate of the episodic buffer. Obtained results after the present work could show emphasis on the role of such regions in functioning of the episodic buffer regarding encoding since high score groups on BLp and BRp showed lower absolute alpha power than the high score groups in such brain regions with significant negative correlation for most regions which wasn’t the case for the FLp and FRp styles. According to the IMM, episodic buffer is the compartment of the WM involved of encoding for the base brain perception styles. The IMM also introduced the other two compartments; the visuo-spatial sketchpad and the phonological loop as responsible for encoding with respect to front right and front left perception styles, respectively which don’t agree with the parietaloccipital- temporal network being the correlate of the visuo-spatial sketchpad as proposed by Parra et al. [16] in terms of the present work results.
At the first glance, the obtained results seem to excel in figuring out differences between individuals in their neural activity pattern at rest that could be successfully described in terms of the styles introduced by the ISI. And upon searching deeper after the secrets of mind as being elucidated by numerous researches in which scientists utilized numerous varieties of techniques and methodologies, one can find that a lot is still hidden after the obtained data. Yet as an overall conclusion, it could be guaranteed that the ISI is able to introduce a promising conceptual frame and applicable tool within a broader theoretical postulate of concept learning -introduced by the IMM-for comprehensive investigation of neural patterns relevant to cognitive tasks eminent to psychological functions of learning and information processing.
References
- Saleh MS, Monir ZM, Saad-Hussein A, et al. Intellectual Style Inventory (ISI): Learning Style Assessment after Cortical Functional Specialization. British Journal of Education, Society and Behavioral Science 4987-1005 (2014).
- Saleh MS. IMM: A Multisystem Memory Model for Conceptual learning. Am. J. Psychol 127(4), 477-488 (2014).
- Saleh MS. The Mind Pyramid. Draft to Digital (2018).
- Saleh MS, Zaki YZ. Development of a Smart Program for the Intellectual Style Inventory. J. of. Artif. Intell 10(1), 91-97 (2017).
- Mahjoory K, Cesnaite E, Hohlefeld FU, et al. (2019). Power and temporal dynamics of alpha oscillations at rest differentiate cognitive performance involving sustained and phasic cognitive control. NeuroImage 188 (1), 135-144 (2019).
- Sadaghiani S, Kleinschmidt A. Brain Networks and α-Oscillations: Structural and Functional Foundations of Cognitive Control. Trends. Cogn. Sci 20(11), 805-817 (2016).
- Benz DC, Tarokh L, Achermann P. Regional differences in trait-like characteristics of the waking EEG in early adolescence. BMC. Neurosci 14(1), 117 (2013).
- Laufs H, Holt JL, Elfont R, et al. (2006). Where the BOLD signal goes when alpha EEG leaves. NeuroImage 31, 1408–1418.
- Burgess PW, Gonen-Yaacovi G, Volle E. Functional neuroimaging studies of prospective memory: What have we learnt so far? Neuropsychologia 49(8), 2246–2257 (2011).
- Yoshida W, Ishii S. Resolution of uncertainty in prefrontal cortex. Neuron 50(5), 781–789 (2006).
- Koechlin E, Basso G, Pietrini P, et al. The role of the anterior prefrontal cortex in human cognition. Nature 399(6732), 148–151 (1999).
- Daw ND, O’Doherty JP, Dayan P, et al. Cortical substrates for exploratory decisions in humans. Nature 441(7095), 876–879 (2006).
- Boorman ED, Behrens TEJ, Woolrich MW, et al. How green is the grass on the other side? Frontopolar cortex and the evidence in favor of alternative courses of action. Neuron 62(5), 733–743 (2009).
- Matthews BR. Memory dysfunction. Continuum (Minneapolis, Minn.), 21(3 Behavioral Neurology and Neuropsychiatry) 613–626 (2015).
- Baddeley A, Jarrold C, Vargha-Khadem F. Working memory and the hippocampus. J. Cogn. Neurosci 23(1), 3855–3861 (2011).
- Parra MA, Della Sala S, Logie RH, et al. Neural correlates of shape−color binding in visual working memory. Neuropsychologia 52(1), 27–36 (2014).
