Research Article - Neuropsychiatry (2017) Volume 7, Issue 4
Mahalanobis-Taguchi System and Its Medical Applications
- Corresponding Author:
- Chao-Ton Su
Department of Industrial Engineering and Engineering Management, National Tsing Hua University, 101, Sec. 2, Kuang-Fu Road, Hsinchu 30013, Taiwan, R.O.C.
Tel: +886-3-5742936
Fax: +886-3-5722204
Abstract
The Mahalanobis–Taguchi System (MTS) is a diagnostic and forecasting technique for multivariate data. MTS does not involve direct learning from a training set, but it settles a classifier by constructing a continuous measurement scale. The construction of an MTS model would not be influenced by data distribution, which is a good property for solving class imbalance problem. This paper elucidates the significance of MTS and demonstrates its application in several medical and healthcare case studies.
betsat bettilt vegabet betkanyon matbet celtabet hilbet melbet kingbetting wipbet pusulabet superbahis lidyabet holiganbet 1xbet asyabahis jetbahis betdoksan betetebet betgram
Keywords
Mahalanobis distance, Mahalanobis–Taguchi System, Classification, Feature selection
Introduction
The Mahalanobis–Taguchi System (MTS), which was developed by Taguchi, is a diagnosis and forecasting technique using multivariate data [1,2]. MTS combines the Mahalanobis distance (MD) with Taguchi’s orthogonal array (OA) and is used to optimize multidimensional systems. The correlation structure of a system is considered in MD, which is employed to construct a multidimensional measurement scale in MTS. OA is a design matrix comprising several columns and rows to arrange an experimental plan. OA is used in MTS to reduce the number of variables in multivariate systems. A review of MTS can be found in Woodall et al. and Ghasemi et al. [3,4].
This paper presents the MTS and its application in several medical and healthcare case studies. The advantages of MTS are also presented.
The MTS
MTS is implemented by first constructing the Mahalanobis space (MS), which is used as a reference or normal group. The samples in the normal group should be similar and have common characteristics. For instance, in medical diagnosis, the MS is constructed using only healthy people.
We assume k items (X1, X2,…, Xk) that should be inspected to discover a liver disease. We first collect a number of normal samples to construct an MS for the reference base. Table 1 lists the collected n raw normal samples with k variables, where xij denotes the original value of the ith variable of the jth normal sample.
| Variable | Sample | X1 | X2 | ... | Xi | ... | Xk |
|---|---|---|---|---|---|---|---|
| 1 | x11 | x21 | ... | xi1 | ... | xk1 | |
| 2 | x12 | x22 | ... | xi2 | ... | xk2 | |
| . . . |
. . . |
. . . |
. . . |
. . . |
. . . |
. . . |
|
| j | x1j | x2j | . . |
xij | . . |
xkj | |
| . . . |
. . . |
. . . |
. . . |
. . . |
. . . |
. . . |
|
| n | x1n | x2n | ... | xin | ... | xkn | |
| Mean | ÃÂÞx1 | ÃÂÞx2 | xi | ÃÂÞxi | ... | ÃÂÞxk | |
| Standard deviation | s2 | s2 | ... | si | ... | sk | |
Table 1: Raw data of normal samples
Standardization of each variable using the mean ÃÂÞxi and standard deviation si is necessary, because the variables have different value ranges. Taguchi suggested the following equation:
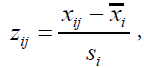 (1)
(1)
where 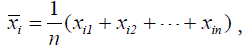 and
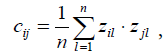
and 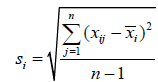 . After standardization, the mean of each feature is 0, and the standard deviation is 1 (Table 2). By employing the standardized data, the correlation matrix describing the relationship structure among variables is obtained as C = [cij], where cij is the correlation coefficient between the standardized ith and jth variables. This coefficient is calculated using the following equation:
| Variable Sample |
X1 | X2 | ... | Xi | ... | Xk |
|---|---|---|---|---|---|---|
| 1 | z11 | z21 | ... | zi1 | ... | zk1 |
| 2 | z12 | z22 | ... | zi2 | . . |
zk2 |
| . . . |
. . . |
. . . |
. . . |
. . . |
. . . |
. . . |
| j | z1j | z2j | ... | zij | zkj | |
| . . . |
. . . |
. . . |
. . . |
. . . |
. . . |
. . . |
| n | z1n | z2n | ... | zin | ... | zkn |
| Mean | 0 | 0 | ... | 0 | ... | 0 |
| Standard deviation | 1 | 1 | ... | 1 | ... | 1 |
Table 2: Standardized data of normal samples
 (2)
(2)
The MD of the jth sample is calculated as follows:
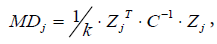 (3)
(3)
where Zj=(z1j,z2j,…,zkj) is a standardized variable vector of the jth sample.
The MS can be regarded as a database for the normal group, and this database consists of its mean vector, standard deviation vector, and covariance matrix. Several abnormal conditions should be defined to validate the scale. The MDs of the abnormal data are computed using the information contained in the MS. The measurement scale is valid if the MDs of the abnormal condition are higher than those of the normal condition. Otherwise, the MS cannot suitably represent the real normal condition and should be reconstructed.
Two-level OA is applied to investigate the effect of each variable on a multivariate system. Each variable is assigned to a column in OA and set with the following two levels: level 1, the variable is included in the system when MS is constructed; and level 2, the variable is excluded from the system when MS is constructed. Then, the signal-to-noise (SN) ratio obtained from the abnormal MDs is used as the response for each run of OA. The larger-the-better SN ratio is usually suggested, primarily because the MDs of abnormal samples should be larger than those of normal ones (that is, a larger MD for an abnormal sample exhibits clearer discrimination). Let d be the number of known abnormal samples collected in advance. For each run of an OA, we can calculate the MDs corresponding to these abnormal conditions using the included variables. The SN ratio corresponding to the pth run of an OA is determined as follows:
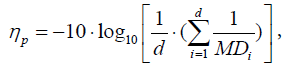 (4)
(4)
Where MDi is the MD corresponding to the ith abnormal sample.
The importance of each variable is evaluated by calculating the effect gain, which is measured by subtracting the average SN ratio of the runs that excluded the variable from that which included the variable. If the gain corresponding to a variable is positive, the variable may be considered as worth keeping. Otherwise, the variable should be removed.
Finally, a reduced model measurement scale is established using the important variables. Then, an appropriate threshold to discriminate between the normal and abnormal groups is determined for future prediction.
Su and Hsiao [5] extended MTS and proposed a multiclass MTS (MMTS) to support multiclass problems. In their study, several multiclass data sets were used to compare the performance of MMTS with that of other popular classification and feature selection algorithms. The results indicated that MMTS outperformed the other algorithms both on classification accuracy and feature selection efficiency.
MTS Applications
The MTS can be applied for two major objectives, namely, diagnosis and forecasting. Several potential applications include medical diagnosis, fire detection, earthquake forecasting, weather forecasting, automotive air bag deployment [1,6], yield prediction [7], product inspection [8], voice recognition [9], and credit score prediction [10]. Several applications of MTS in medical and healthcare cases are presented.
The relationship between the medical examination data and liver malfunction symptom was determined. Su and Li [11] chose 89 individuals who were labeled as normal individuals and 79 individuals labeled as liver malfunction patients based on the medical history of the patients as judged by doctors. A total of 30 medical examination items (including sex, age, neutrophil, lymphocyte, monocyte, and eosinophil) of these 168 people were used as inputs in the study. MTS was applied, and 14 medical examination items were deleted. The percentage of correct classification was 92.54% when the remaining 16 items were used as inputs. These results showed that MTS can delete unimportant items in a multi-dimensional information system. This study provides a valuable reference for doctors in diagnosing an early-stage disease.
Lin [12] applied MTS to analyze the data of patients in an ordinary ward of a hospital to build a clinical alert system for in-hospital cardiac arrest. After implementation, the selected system features were diastolic blood pressure (DBP), temperature, pulse, and respiratory rate. Thus, a new alert standard was established by the MD. Moreover, three commonly used classification methods, namely, artificial neural network, decision tree, and logistic regression, were implemented using the same data set. The result showed that MTS had better classification rate.
Buenviaje et al. [13] applied MTS to the deliriumevidence- based bundle by using the dataset obtained from the Johns Hopkins Hospital. The MD was calculated for the retrospective healthy and unhealthy observations. They discovered that the sufficient variation in the CAM-ICU assessment (the standard for delirium assessment) would benefit from knowledge of how different the MD is from the healthy average. TheMTS applied to the delirium-evidence-based bundle could detect medical patterns in retrospective datasets.
Pressure ulcers can induce serious problems during patient care processes. A pressure ulcer is an area of localized damage to the skin and underlying tissue caused by pressure, shear, friction, or a combination of these factors. Pressure ulcers are difficult to prevent in the operating room during a long surgical procedure. Moreover, the risk factors involved in developing pressure ulcers for surgical patients remain unclear. Preventing the prevalence of pressure ulcers is challenging as shown in past preventive policies. Su et al. [14] employed the MTS to predict pressure ulcer development in surgical patients and identify risk factors from data collected from patients during surgical procedures. In their studies, a total of 244 patients consisting of several incidence and absence of pressure ulcers were studied from 2006 to 2007. The data included 26 attributes, such as gender, age, and surgical room. For comparison, four techniques, namely, MTS, support vector machines, decision tree, and logistic regression, were performed. Implementation results showed that weight, course, body position, and air condition were crucial for predicting pressure ulcers. Among the different attributes, weight, course, and body position are the most crucial. During a surgical operation, physicians may pay more attention to overweight patients. Surgical course, especially for cardiac surgery, is highly related to the development of pressure ulcers. The body position of surgical patients lying down (face up) indicates an incidence of pressure ulcer in the high risk group. Moreover, this study found that MTS has better performance in the index of sensitivity, indicating high predictive accuracy in the development of pressure ulcers. Moreover, MTS can successfully predict the minority class in the medical data.
Women with history of gestational diabetes mellitus have been considered high risk for type 2 diabetes mellitus. Identifying the relative risk factors for the development of type 2 diabetes mellitus from gestational diabetes mellitus is important. Appropriate enforcement of health care education, remedy, and followup monitoring of the identified risk factors is expected to postpone and avoid the occurrence of type 2 diabetes mellitus in women with history of gestational diabetes mellitus. Su and Hsiao [5] conducted a case study in a general hospital by collecting 12 attributes of women with gestational diabetes mellitus. Among the 558 gestational diabetes mellitus registrants, 152 subjects were available and successfully completed the follow-up examination for type 2 diabetes mellitus. The examination results were grouped into three categories according to the criterion set by the Department of Health. This problem was formulated as a classification and feature selection task on three-class problem; thus, the MMTS algorithm was utilized. After implementation, four attributes were identified and considered important as risk factors for predicting type 2 diabetes mellitus after gestational diabetes mellitus. The classification accuracies of predicting diabetes mellitus, prediabetes mellitus, and normal subjects were 0.8, 0.6, and 0.61, respectively. Through confirmation using the domain knowledge provided by the physicians in the hospital, the predictive accuracy achieves a meaningful level on health care. That is, physicians can more effectively diagnose the future health condition of women with gestational diabetes mellitus by predicting the occurrence of type 2 diabetes mellitus using the gestational diabetes mellitus attributes found by MMTS.
Obstructive sleep apnea (OSA) has become an important public health concern. Polysomnography (PSG) is traditionally considered an established and effective diagnostic tool that provides information on the severity of OSA and degree of sleep fragmentation. However, the numerous steps in the PSG test to diagnose OSA are costly and time consuming. Su et al. [15] applied the MMTS based on anthropometric information and questionnaire data to predict OSA. They analyzed 86 subjects (62 diseased and 24 non-diseased participants). A total of 12 attributes were found in the collected OSA data. These attributes included anthropomorphic measurements (i.e., age, gender, height, weight, and body mass index), systolic blood pressure (SBP), DBP, frequency of desaturation (DI3, DI4), frequency of paroxysmal leg movements per hour (PLM), and questionnaire measurements (ESS, SOS). Implementation results demonstrated that six attributes, namely, age, weight, SBP, DBP, DI3, and DI4, are important. Moreover, MMTS had an accuracy of 84.38% on OSA prediction and achieved better performance compared with other approaches, such as logistic regression, neural networks, support vector machine, C4.5 decision tree, and rough set. Therefore, MMTS can assist doctors in the pre-diagnosis of OSA before running the PSG test, thereby enabling a more effective use of medical resources.
Discussion
MTS is a collection of methods proposed for diagnosis and forecasting. MTS can be used not only to execute classification tasks but also to identify the important variables of a multivariate system. The methods used in MTS include data analysis instead of probability-based inference, which implies that MTS does not require any assumptions on the distribution of input variables. Moreover, MTS does not require any parameters to optimize its execution, whereas much time is consumed in fine-tuning the parameters in other available techniques, such as neural network and support vector machine.
In MTS, every sample outside the normal space (i.e., abnormal sample) is regarded as unique and does not constitute a separate population. This property makes MTS powerful for imbalanced data analysis. Su and Hsiao [8] investigated the effect caused by the imbalanced data set on MTS and other popular classification techniques, such as stepwise discriminate analysis, decision tree analysis, back propagation neural network, and support vector machine. They found that MTS performed robustly against the class imbalance problem regardless of the data sizes and complexity of problems.
The majority of the data in the medical field are imbalanced, that is, the minority class is difficult to predict effectively on a skewed medical data set. For instance, neuropsychiatric symptoms are often difficult to identify. Here, implementing the MTS is suggested to obtain better robustness for imbalanced data problem.
Declaration of Interests and Source of Funding
Dr. Su receives research support from the National Tsing Hua University and the Ministry of Science and Technology (MOST), Taiwan. No financial conflicts are reported. This study is partially supported by the MOST (Taiwan) under Grant No. 104-2221-E-007 -064 -MY3.
References
- Taguchi G, Chowdhury S, Wu Y. The Mahalanobis-Taguchi System. McGraw-Hill (2001).
- Taguchi G, Jugulum R. The Mahalanobis-Taguchi Strategy. John Wiley & Sons, New York, USA (2002).
- Woodall WH, Koudelik R, Tsui KL, et al. A Review and Analysis of the Mahalanobis-Taguchi System. Technometrics 45(1), 1-15 (2003).
- Ghasemi E, Aaghaie A, Cudney EA. Mahalanobis Taguchi system: a review. International Journal of Quality & Reliability Management 32(2), 291-307 (2015).
- Su CT, Hsiao YH. Multi-class MTS for Simultaneous Feature Selection and Classification. IEEE. T. Knowl. Data. En 21(2), 192-205 (2009).
- Taguchi G, Chowdhury S, Wu Y. Taguchi’s Quality Engineering Handbook. John Wiley & Sons, Inc (2005).
- Asada M. Wafer Yield Prediction by the Mahalanobis-Taguchi System. IIE. Transactions 14, 25-28 (2001).
- Su CT, Hsiao YH. An Evaluation of the Robustness of MTS for Imbalanced Data.IEEE. T. Knowl. Data. En 19(10), 1321-1332 (2007).
- Hsiao YH, Su CT. Multi-class MTS for Saxophone Timbre Quality Inspection Using Waveform Shape-based Features. IEEE. T. Syst. Man. Cy. B 39 (3), 690-704 (2009).
- Su CT, Wang HC. Robust Design of Credit Scoring System by the Mahalanobis-Taguchi System. Asian Journal on Quality5(2), 1-16 (2004).
- Su CT, Li TS. Neural and MTS algorithms for Feature Selection. Asian Journal on Quality 3(2), 113-131 (2002).
- Lin YT. Applying MTS to Cardiopulmonary Resuscitation Prediction. Master thesis, Department of Industrial Engineering and Engineering Management, National Tsing Hua University, Taiwan (2014).
- Buenviaje B, Bischoff JE, Roncace RA, et al. Mahalanobis-Taguchi System to Identify Preindicators of Delirium in the ICU. IEEE. J. Biomed. Health. Inform 20(4): 1205-1212 (2016).
- Su CT, Wang PC, Chen YC, et al. Data Mining techniques for Assisting the Diagnosis of Pressure Ulcer Development in Surgical Patients. J. Med. Sys 36(4), 2387-2399 (2012).
- Su CT, Chen KH, Chen LF, et al. Pre-Diagnosis of Obstructive Sleep Apnea via Multi-Class MTS. Computational and Mathematical Methods in Medicine 2012 (2012): Article ID 212498.