Short Article - Neuropsychiatry (2018) Volume 8, Issue 1
Characterization of Intrinsic Optical Signal during Spreading Depolarization
- Corresponding Author:
- Jianping Lv
Department of Neurosurgery, Guangzhou First People’s Hospital, Guangzhou Medical University, Panfu Road No.1, 510180 Guangzhou, China
Tel: +86-20-81048204
Fax: +86-20-81048304
Abstract
Abstract
Spreading depolarization (SD) is a transient wave of near-complete neuronal and glial depolarization related to massive transmembrane ionic and water shifts. It spreads slowly at a rate of millimeters per minute in the central nervous system. Although mechanisms of SD initiation and propagation are still debate, abundant experimental and clinical evidence has demonstrated that SD emerges as the mechanism of migraine aura and secondary brain injury after subarachnoid hemorrhage, traumatic brain injury, and ischemic stroke. Therefore, it is essential to detect SD in animals and human with appropriate methods. Optical imaging of intrinsic signals (OIS) is a functional brain imaging technique with high spatial-temporal resolution and it is suitable for studying SD. In OIS, information about changes in cell swelling, cerebral blood volume, and oxygenated and deoxygenated hemoglobin following SD can be acquired. Moreover, OIS provides information in spatial and temporal patterns of SD. In this article, we will review studies in which OIS is used to record SD and summarize the characteristics of OIS responses to SD. Moreover, challenges for OIS will be discussed.
Keywords
Optical imaging of intrinsic signal, Optical profile, Spatial-temporal pattern, Spreading depolarization
Introduction
Spreading depolarization (SD), discovered by Leao in 1944, is a slowly propagating wave of rapid, near-complete depolarization of neuron and glial cells in central nervous system [1]. This spreading wave can silence brain electrical activity for several minutes (spreading depression). It usually spreads at a velocity of 2-5 mm/min and resolves after 5 to 15 minutes. SD is characterized by the dramatic imbalance of ion hemostasis and profound disruption of ion gradients between intra- and extracellular spaces. It is accompanied by a rapid increase in [K+]e to 30–60 mM, a rapid decrease in [Na+]e and [Cl–]e to 50–70 mM and in [Ca2+]e to 0.2–0.8 mM [2]. The influx of Ca2+ leads to release of many excitotoxic neurotransmitters, such as glutamate, aspartate, glycine within the depolarized tissue. The imbalance of ion hemostasis favors the osmotic movement of water causing the neuron swell and dendrites distort. For restoration of ion gradients and recycling of neurotransmitters, Na+-K+-ATPase and other ATP dependent pumps are activated, leading to stimulation of ATP consumption. The changes in high-energy phosphates are accompanied by oxygen and glucose consumption. To insure brain’s supply of oxygen and glucose, the cerebral blood flow (CBF) increases (spreading hyperemia) by ~100% to 200%. The hyperemia usually lasts up to 3 min and gives way to persistent (one hour or longer) flow reduction of 10% to 40% (spreading oligemia) because of cortical arteriolar constriction [3]. However, in pathological states, such as reduced perfusion pressure and ischemia, SD may trigger spreading ischemia instead of spreading hyperemia due to an inverse neurovascular response. In such cases, severe arteriolar spasm instead of vasodilatation is coupled to the depolarization phase of SD. SD-induced spreading ischemia is so severe that it dramatically delays the energy-dependent recovery of SD and even leads to widespread necrosis of cortical neurons and astrocytes [4]. Experimental and clinical data has demonstrated that SD occurs abundantly after aneurysmal subarachnoid hemorrhage, intracerebral hemorrhage, traumatic brain injury, malignant hemispheric stroke, and epilepsy and plays an important role in secondary brain injury [5-8]. Moreover, SD is the pathophysiological substrate of migraine aura and a trigger for headache [9].
Several methods with good temporal or spatial resolution have been applied in SD studies. Electrocorticography (ECoG) and deep electrodes have been used for most of SD recording in animal and human brain [10-12]. They have excellent temporal resolution, but recordings are only made on special locations. Also, magnetic resonance imaging (MRI) is used to record SD in several studies [13,14]. MRI is capable of collecting three-dimensional spatial information at different timepoints, but spatial resolution is only millimeter. Optical imaging of intrinsic signals (OIS), measuring cortical reflectance changes, is a functional brain image technique with second temporal resolution and micron spatial resolution [15]. In vivo, optical changes are spatially related to neuronal activity and are owing to changes in light scattering, blood volume, and hemoglobin and cytochrome oxidation state. OIS is particularly appropriate for studying SD, because 1) a large-scale cerebral cortex can be studied simultaneously and numerous timepoints can be got over time as SD waves propagate; 2) OIS is able to provide information about propagating patterns of SD [16]; 3) OIS in multi-wavelength studies can correlate perfusion-related changes to electrophysiological changes of SD [17]; 4) it is important to identify the optical profile of SD, since OIS studies involving seizure, electrical stimulation, or mechanical perturbation of the cortex can inadvertently induce SD. In the past few years, OIS has been used to study SD in normal and pathological conditions [18]. In this review, we will discuss characteristics of SD in OIS.
▪ Setup requirements for OIS
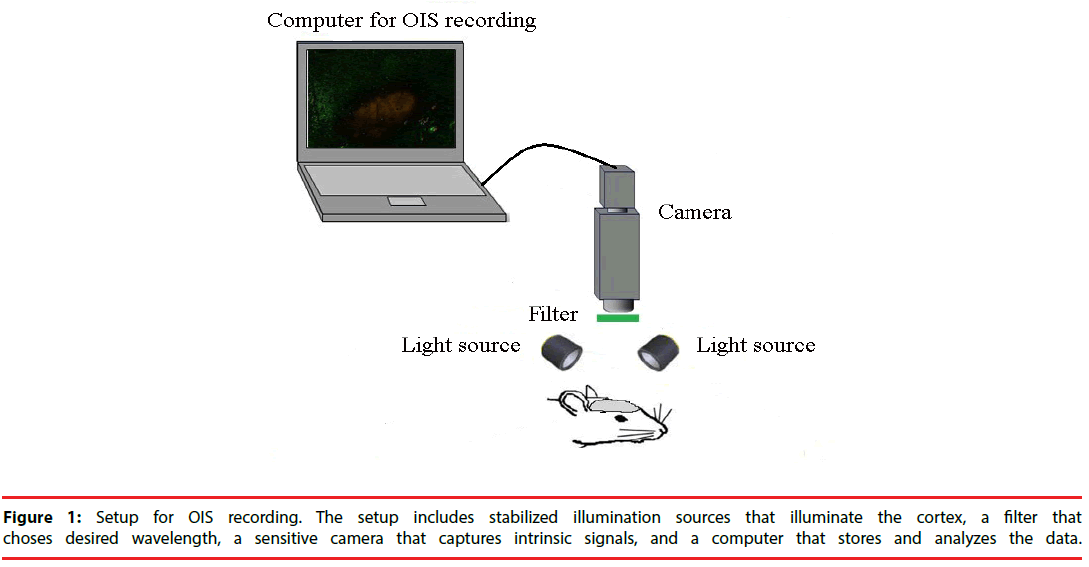
A typical setup for OIS is depicted in Figure 1. In cats, swine and monkeys, the skull and dura above the area of interest are removed [16]. A stainless-steel chamber is mounted onto the skull around the opening area with dental cement. It is filled with silicon oil and sealed with a glass coverslip. The chamber minimizes the movement induced by heart-beat and respiration and thus, improves the quality of OIS images. In rats and mice, however, OIS images could be acquired through the thinned skull and no chamber is needed [19].
The surface of cortex or skull is illuminated with broad-spectrum light by white light-emitting diodes or halogen lamp. Then the light passes through interference filter which choses the desired wavelength for imaging. The choice of wavelength relies on the source of intrinsic signal to be utilized. If oximetry components dominate intrinsic signals, it will be appropriate to use a filter of 595-605nm wavelength [20]. In many situations, however, light scattering component is strong and useful for functional imaging. In these cases, longer wavelengths (up to 750 nm) are preferable, because they can penetrate more deeply into the tissue. Functional maps have also been acquired at wavelengths of 900 nm and above [20].
After the cortex has been stabilized and illuminated, its image has to be captured by cameras with the help of lens. Different lens can be used depending on the size of imaging area. Usually, a tandem-lens arrangement (“macroscope”) is used. The macroscope can easily be built by connecting two camera lenses “front-to-front”. This device can provide high magnification, high numeric aperture, shallow depth of field, and a long working distance [21].
A slow-scan, cooled charge coupled device (CCD) camera or a sensitive video-camera can be used for imaging [22]. Slow-scan digital CCD cameras have a very good signal-to-noise ratio and offer high spatial resolution with moderate cost and complexity. The disadvantage of CCD cameras is a relatively low readout speed. However, this disadvantage is of little importance for the slow intrinsic signals. Therefore, CCD cameras are well suitable for such signal experiments. Video cameras increase the spatial resolution, but they have lower temporal resolution of at most 16.6 ms [23]. However, the more important basic problem is that standard video cameras have the limited signal-to-noise ratio of approximately 200:1 [24]. Nonetheless, some modern cameras have overcome this problem and offer a signalto- noise ratio close to 1000:1. CCD cameras excel can provide consistent high-quality images at low illumination levels. Nevertheless, at moderate light levels, if the detector noise is not the restrictive factor, video cameras will provide better images due to their higher frame rate.
The CCD camera or video cameras are connected with a computer that stores OIS images for the off-line analysis and provides a live view of the exposed cortex. The computer also shows the amplified image intensity differences from a manually chosen reference image. The images within a predefined time-range could continuously be played back and forth to review the intensity changes caused by SD.
▪ Optical profile of SD in OIS
SD is associated with disturbance of ion gradients and cell swelling. For restoring hemostasis, Na+- K+-ATPase is activated and O2 and glucose consumption increase, leading to increase of CBF and cerebral blood volume (CBV). As a result, the state of hemoglobin and cytochrome oxygenation changes. Therefore, the optical reflectance changes, which can be measured by OIS. These factors, like cell swelling, changes in CBV, hemoglobin and cytochrome oxygenation, have different absorbance spectra. Thus, it is likely to highlight different physiological phenomena by filtering reflected light at diverse wavelengths.
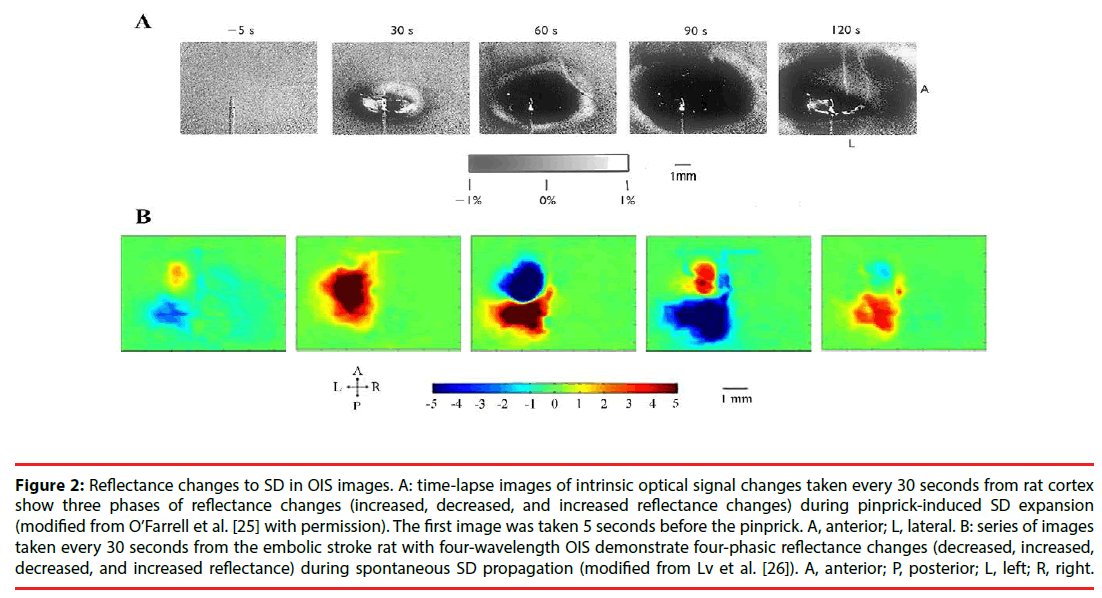
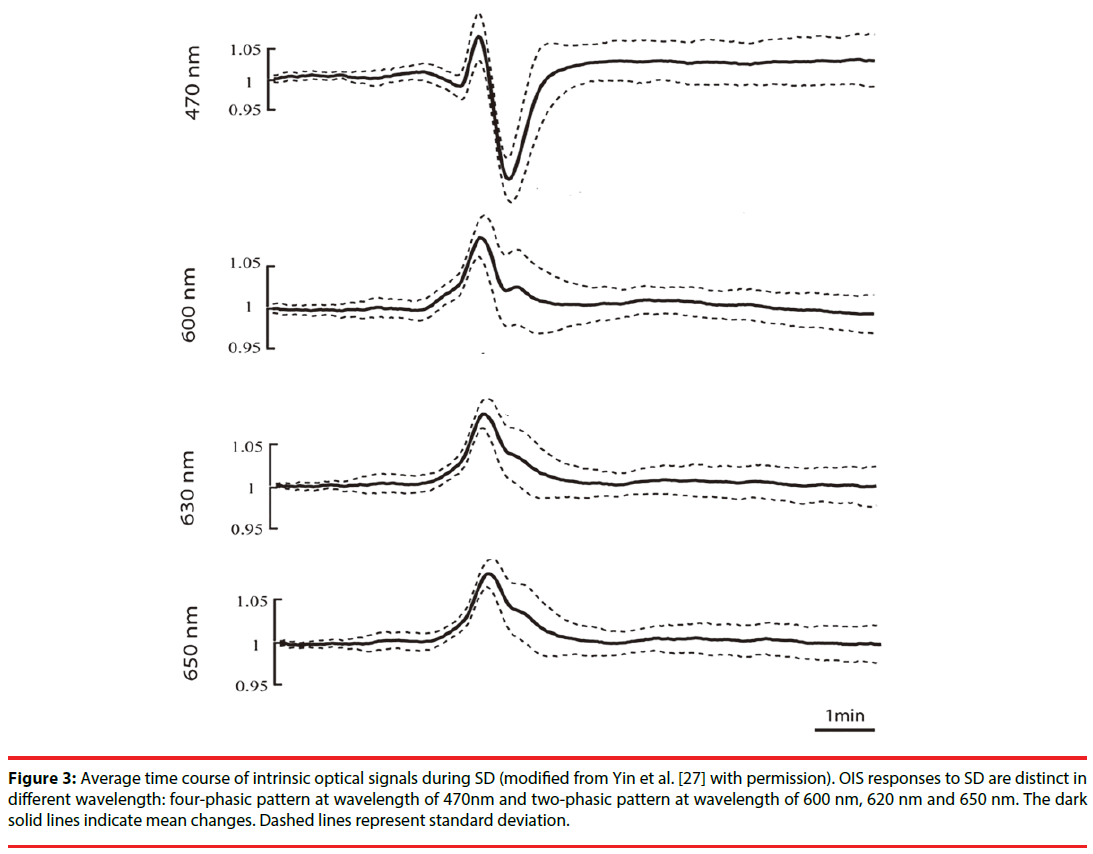
In optical images, SD usually has a tri-phasic pattern of increased, decreased and increased reflectance [25]. However, Lv et al. , using fourwavelength OIS (478, 588, 610, and 625nm), recorded four-phasic reflectance responses to SD in mice with middle cerebral artery occlusion model (Figure 2) [26]. In addition, during the optical time course that is derived from the region of interest in optical images, OIS responses to SD show a four-phasic pattern including initial slight decreased (phase 1), increased (phase 2), largely decreased (phase 3) and increased reflectance (phase 4) (Figure 3) [27]. This difference may be due to hard recognition for initial slight decreased reflectance in OIS images. Nonetheless, at wavelengths of 600, 610, 630, and 650nm, the optical response has only two phases (phase 2 and phase 3): the increased phase 2 includes an initial slow rise (phase 1s) and a fast increase thereafter (phase 1f ); the decreased phase 3 contains an initial fast drop (phase 3f ) and later a slow prolonged decrease (phase 3s) [27]. Different phases of reflectance changes represent perfusion-related or nonperfusionrelated components. The initial slight decreased reflectance (phase 1) could be because of cell swelling, since cell swelling is expected to induce decrease of reflectance [28]. The phase 2 response to SD at multi-wavelength usually is consistent in time, amplitude, and appearance [15]. Therefore, light scattering is considered to be the main optical signal during phase 2. And changes in CBV may lead to light scattering changes [29]. Nonetheless, intravascular dye studies have shown that there is no change in CBV during phase 2 [15]. One study carried out by Mueller and Somjen in hippocampal tissue slices of rats suggested that mitochondrial swelling, beading of dendrites, and ultrastructural changes might lead to the increase of light scattering, following SD induction [30]. The phase 3 is consistent with the decrease of light scattering. Yin et al. showed that the decrease of light scattering was due to the increase of oxygenated hemoglobin (that is the increase in CBV) [27]. The study from Nemoto et al. also displayed the same result [29]. Moreover, intravascular dye studies suggested CBV increased during phase 3. However, Holthoff and Witte demonstrated that the decrease of light scattering may be because of cell swelling [28]. Therefore, more studies are necessary for uncovering the events underlying phase 3. The phase 4 is correlated with the decrease in CBV. O’Farrell et al. demonstrated that the spatial-temporal pattern of OIS response during phase 4 was very similar to the reduction in CBV observed with the dye study [25]. However, Ba et al. suggested that phase 4 signals could not be due solely to reduction in CBV [15].
Figure 2: Reflectance changes to SD in OIS images. A: time-lapse images of intrinsic optical signal changes taken every 30 seconds from rat cortex show three phases of reflectance changes (increased, decreased, and increased reflectance changes) during pinprick-induced SD expansion (modified from O’Farrell et al. [25] with permission). The first image was taken 5 seconds before the pinprick. A, anterior; L, lateral. B: series of images taken every 30 seconds from the embolic stroke rat with four-wavelength OIS demonstrate four-phasic reflectance changes (decreased, increased, decreased, and increased reflectance) during spontaneous SD propagation (modified from Lv et al. [26]). A, anterior; P, posterior; L, left; R, right.
Figure 3: Average time course of intrinsic optical signals during SD (modified from Yin et al. [27] with permission). OIS responses to SD are distinct in different wavelength: four-phasic pattern at wavelength of 470nm and two-phasic pattern at wavelength of 600 nm, 620 nm and 650 nm. The dark solid lines indicate mean changes. Dashed lines represent standard deviation.
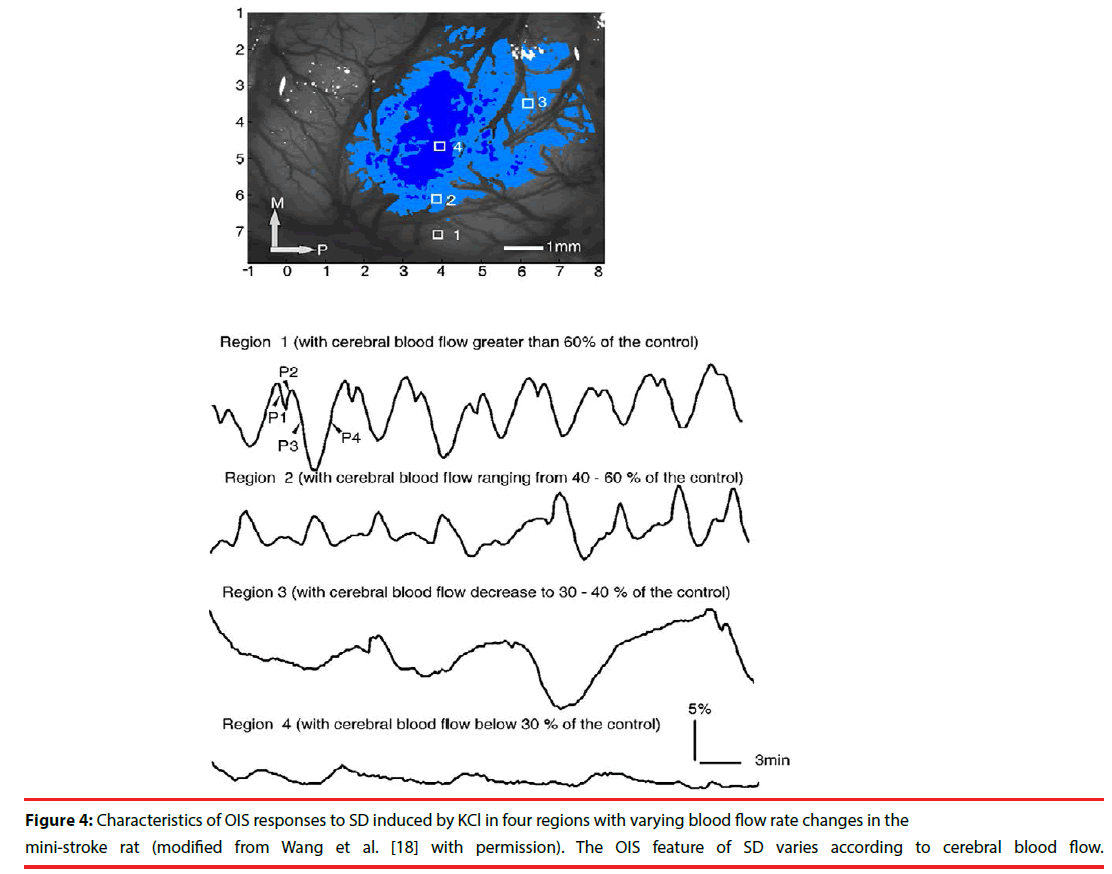
In pathological conditions, SD occurs spontaneously and the optical profile of SD is different from that in normal situation. In one study with mini-stroke model in rats, OIS responses to SD changed following different CBF: in the region with CBF greater than 60% of the control, the reflectance change was the same as that in normal condition; in the region with CBF ranging from 40-60% of the control, the amplitude of phase 2 increased and the amplitude of phase 3, however, decreased; in the region with CBF decreasing to 30-40% of the control, the number of SD decreased and the duration of SD increased; in the region with CBF below 30% of the control, no SD occurred (Figure 4) [18]. In another study with middle cerebral artery occlusion (MCAO) model in rats, the optical characteristics of SD changed diversely according to different regions of brain following the time course of MCAO [31]. After MCAO model, the spontaneous SD in the normal region induced similar reflectance changes to that in normal brain. In penumbra region, the initial increased reflectance was seen, but the decreased phase did not significantly occur and the reflectance only slowly recovered to the baseline value. In addition, Bere et al. implicated that the optical responses to SD could be classified into three types in rats with forebrain ischemia: persistent increased reflectance, intermediate increased reflectance, and transient increased reflectance [32]. And the persistent increased reflectance was accompanied by a sustained decrease of CBF. The intermediate increased reflectance was followed by a transient reduction of CBF. There was no obvious CBF change following the transient increased reflectance. These studies suggest that the features of the optical response to SD reflect changes in CBF and might serve as a marker of normal or partial function in pathological states.
Figure 4: Characteristics of OIS responses to SD induced by KCl in four regions with varying blood flow rate changes in the mini-stroke rat (modified from Wang et al. [18] with permission). The OIS feature of SD varies according to cerebral blood flow.
▪ Spatial-temporal patterns of SD in OIS
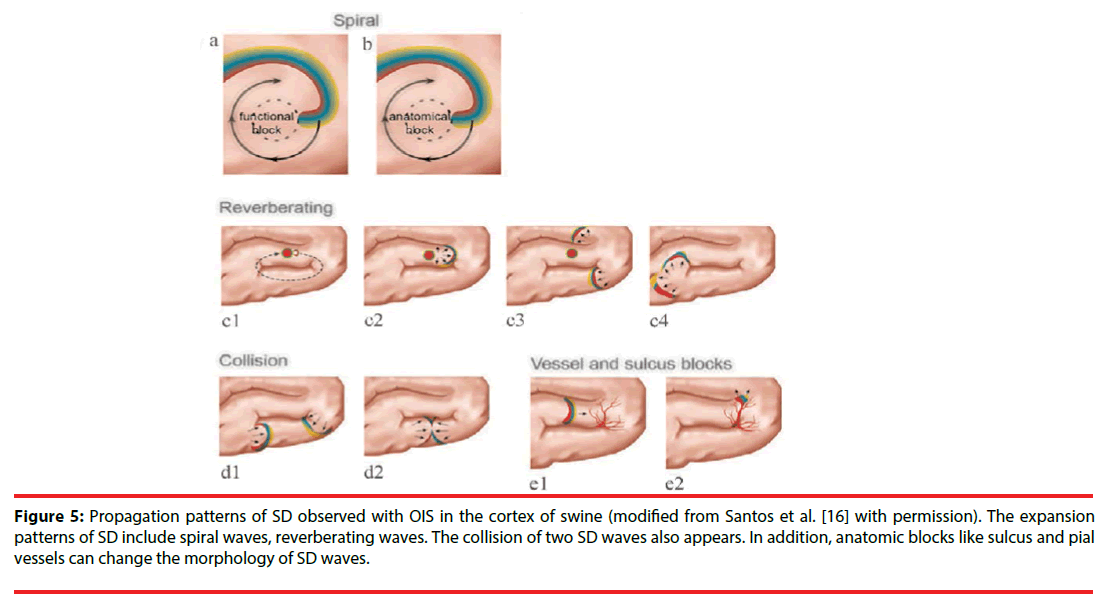
The spatial-temporal patterns of SD can be studied by OIS, since OIS has high spatial and temporal resolution. The origin site of SD can be easily determined in OIS. Usually, for each SD wave, a small area with reflectance change first appears in OIS, then an arc-shaped wavefront propagates from the spot peripherally. Accordingly, the small site is regarded as the origin of SD. In the normal brain tissue, the origin of SD locates at the pinprick or potassium-stimulating site [16,25]. Under pathological conditions such as stroke, SD originates from the area where CBF reduces to a critical threshold (like penumbra area). Furthermore, one study by Chen et al. showed that origin sites of SD waves could migrate in the cerebral cortex of rats with permanent MCAO [33]. Also, different propagation patterns of SD are observed in OIS. Bere et al. using OIS in multi-focal stroke model in rats found that some SD waves gradually got extinguished and some SD waves might avoid the cortical region with lowest perfusion within the field of view during the propagation [34]. Santos et al. detected diverse expansion patterns of SD with OIS in the cortex of swine: spiral wave, reverberating wave, and collision of two waves (Figure 5) [16]. The spiral wave rotates either around a dynamical functional block or around an anatomical block and is circumscribed by a spiral-shaped SD front. The reverberating wave cycles around anatomical and functional blocked areas such as the sulci, forming a closed-loop pathway. Here, a functional block refers to a block that transiently forms as an intrinsic property of the SD wave dynamics. Conversely, an anatomical block refers to non-excitable tissue, possibly an infarct region or an artificially-created lesion. When two SD waves collide, they interact and can block each other, as a consequence of the refractoriness of the excitable medium [16]. When a more lateral collision occurs, the colliding parts of both wavefronts annihilate each other; however, other parts merge to form a wave with a large wavefront [35]. Moreover, Kauffman et al. using potassium to induce SD in cerebral cortex of mice, found spiral and reverberating SD waves [36]. Besides, they discovered that SD in different location of induction had different reflectance changes and different propagation patterns. These differences might be due to cytoarchitecture modulation. Additionally, sulcus and pial vessels are able to limit SD propagation and modify the propagation direction. And, the vessels modification is unpredictable [37].
Figure 5: Propagation patterns of SD observed with OIS in the cortex of swine (modified from Santos et al. [16] with permission). The expansion patterns of SD include spiral waves, reverberating waves. The collision of two SD waves also appears. In addition, anatomic blocks like sulcus and pial vessels can change the morphology of SD waves.
In summary, OIS is very appropriate for studying spatial-temporal patterns of SD with the benefit of high resolution in time and space. In OIS, SD waves display distinct expansion and propagation patterns. The heterogeneous spatial-temporal patterns of SD might be due to heterogeneity in cytoarchitecture and vascular architecture.
▪ Challenges of OIS
Although OIS shows much promise for using as a research tool for SD, some challenges remain. Some of the greatest challenges are related to penetration depth of OIS, imaging precision, biological noise, and motion artifacts. Most of them can be resolved. OIS applicates to only superficial layers of the brain tissue because of light attenuation induced by light absorption and scattering. The depth sensitivity of OIS is limited to the top 500 μm with exponential weighting toward the surface [38]. Correcting sampleinduced aberration could extend the imaging depth limit by improving the in-focus signal, but scattering still poses the ultimate limit. We can use longer excitation wavelength in vivo and tissue clearing methods ex vivo to reduce tissue scatter and thus, to increase penetration depth. Moreover, OIS has an unavoidable restraint on mapping resolution: the large spatial spread of measured response. Thus, OIS does not provide a much more precise mapping of stimulus space. This is a consequence of neural circuitry and the finite spatial resolution of intrinsic signals [39], which together cause a single point in cortical space to induce reflectance changes in a rather large cortical area. Therefore, spread of optical signals inevitably produces false-positive areas on OIS maps. Additionally, plenty of major biological signal sources in OIS are not related with neural activity but with respiratory and heartbeat and are therefore “noise”. The main sources of this biological noise are the socalled vasomotion signal as well as heartbeat and respiration artifacts at their respective essential frequencies and harmonics [40]. Synchronization of heartbeat and respiration with image acquisition can reduce their effects on OIS images. Accumulation of a large number of trials should average out periodic artifacts. Alternatively, temporal filtering of the intrinsic signal may be used to eliminate periodic artifacts [41].
Conclusion
Despite challenges of OIS, it enables visualization of SD at large cortex surface with high spatial and temporal resolution. The optical response to SD varies at different wavelength. In addition, different phases of optical response to SD represent changes in perfusion-related or nonperfusionrelated components, like CBV, cell swelling, hemoglobin and cytochrome oxygenation. Thus, under pathological conditions, the optical profile of SD might be regarded as a marker of normal or partial function. Moreover, SD appears with heterogeneous spatial-temporal patterns in OIS. The heterogeneity may be due to the effect of vessels in the cerebral cortex and the anatomical configuration of the brain.
Acknowledgment
Dr. Jianpin Lv was supported by Guangzhou Science and Technology Program (No. 201510010103) and Natural Science Foundation of Guangdong Province (Grant No.2014A030313002).
References
- Smith JM, Bradley DP, James MF, et al. Physiological studies of cortical spreading depression. Biol Rev 81(1), 457-481 (2006).
- Lauritzen M, Dreier JP, Fabricius M, et al. Clinical relevance of cortical spreading depression in neurological disorders: Migraine, malignant stroke, subarachnoid and intracranial hemorrhage, and traumatic brain injury. J. Cereb. Blood. Flow. Metab 31(1), 17-35 (2011).
- Dreier JP. The role of spreading depression, spreading depolarization and spreading ischemia in neurological disease. Nat. Med 17(1), 439-447 (2011).
- Dreier JP, Ebert N, Priller J, et al. Products of hemolysis in the subarachnoid space inducing spreading ischemia in the cortex and focal necrosis in rats: A model for delayed ischemic neurological deficits after subarachnoid hemorrhage? J. Neurosurg 93(1), 658-666 (2000).
- Dreier JP, Woitzik J, Fabricius M, et al. Delayed ischaemic neurological deficits after subarachnoid haemorrhage are associated with clusters of spreading depolarizations. Brain 129(1), 3224-3237 (2006).
- Hinzman JM, Norberto A, Shutter LA, Okonkwo DO, Clemens P, Strong AJ, et al. Inverse neurovascular coupling to cortical spreading depolarizations in severe brain trauma. Brain. A. Journal. Of. Neurology 137(1), 2960-2972 (2014).
- Woitzik J, Hecht N, Pinczolits A, et al. Propagation of cortical spreading depolarization in the human cortex after malignant stroke. Neurology 80(1),1095-1102 (2013).
- Kramer DR, Fujii T, Ohiorhenuan I, et al.Interplay between cortical spreading depolarization and seizures. Stereotactic. & Functional. Neurosurgery 95(1), 1 (2017).
- Eikermann-Haerter K, Ayata C. Cortical spreading depression and migraine. Nature. Reviews. Neurology 10(1), 167-173 (2010).
- Bosche B, Graf R, Ernestus RI, et al. Recurrent spreading depolarizations after subarachnoid hemorrhage decreases oxygen availability in human cerebral cortex. Ann. Neurol 67(1), 607-617 (2010).
- Carlson AP, William Shuttleworth C, et al. Cortical spreading depression occurs during elective neurosurgical procedures. Journal. Of. Neurosurgery1-8 (2016).
- Amemori T, Bures J. Ketamine blockade of spreading depression: Rapid development of tolerance. Brain. Research 519(1), 351-354 (1990).
- Beaulieu C, Busch E, de Crespigny A, et al. Spreading waves of transient and prolonged decreases in water diffusion after subarachnoid hemorrhage in rats. Magn. Reson. Med 44(1), 110-116 (2000).
- Bradley DP, Smith MI, Netsiri C, et al. Diffusion-weighted mri used to detect in vivo modulation of cortical spreading depression: Comparison of sumatriptan and tonabersat. Experimental. Neurology 172(1), 342-353 (2001).
- Ba AM, Guiou M, Pouratian N, et al. Multiwavelength optical intrinsic signal imaging of cortical spreading depression. J. Neurophysiol 88(1), 2726-2735 (2002).
- Santos E, Schöll M, Sánchez-Porras R, et al. Radial, spiral and reverberating waves of spreading depolarization occur in the gyrencephalic brain. Neuro. Image 99(1), 244-255 (2014).
- Bere Z, Obrenovitch TP, Kozák G, et al. Imaging reveals the focal area of spreading depolarizations and a variety of hemodynamic responses in a rat microembolic stroke model. Journal. Of. Cerebral. Blood Flow. & Metabolism 34(1), 1695-1705 (2014).
- Wang Z, Li P, Luo W, et al. Peri-infarct temporal changes in intrinsic optical signal during spreading depression in focal ischemic rat cortex. Neuroscience. Letters 424(1), 133-138 (2007).
- Brennan KC, Beltrán-Parrazal L, López-Valdés HE, et al. Distinct vascular conduction with cortical spreading depression. Journal. Of. Neurophysiology 97(1), 4143-4151 (2007).
- Grinvald A, Frostig RD, Lieke E, et al. Optical imaging of neuronal activity. Physiol. Rev 68(1), 1285-1366 (1988).
- Frostig RD, Masino SA, Kwon MC, et al. Using light to probe the brain: Intrinsic signal optical imaging. International. Journal. Of. Imaging. Systems. & Technology 6(1), 216-224 (2010).
- Ts'O DY, Frostig RD, Lieke EE, et al. Functional organization of primate visual cortex revealed by high resolution optical imaging. Science 249(1), 417-420 (1990).
- Kauer JS. Real-time imaging of evoked activity in local circuits of the salamander olfactory bulb. Nature 331(1), 166 (1988).
- Bonhoeffer T, Grinvald A. Optical imaging based on intrinsic signals: The methodology. C. A. Brain. Mapping. The. Methods. 1996
- O'Farrell AM, Rex DE, Muthialu A, et al. Characterization of optical intrinsic signals and blood volume during cortical spreading depression. Neuroreport 11(1), 2121-2125 (2000).
- Lv J, Cao Z, Lee J. Application of 4-wavelength optical intrinsic signal imaging in monitoring peri-infarct depolarizations in gfap(⁺/⁺)vim(⁺/⁺) mice. Nan. Fang. Yi. Ke. Da. Xue. Xue. Bao 35(1), 417-421 (2015).
- Yin C, Zhou F, Wang Y, et al. Simultaneous detection of hemodynamics, mitochondrial metabolism and light scattering changes during cortical spreading depression in rats based on multi-spectral optical imaging. Neuroimage 76(1), 70-80 (2013).
- Holthoff K, Witte OW. Intrinsic optical signals in rat neocortical slices measured with near-infrared dark-field microscopy reveal changes in extracellular space. Journal. Of. the. Society. For. Neuroscience 16(1), 2740 (1996).
- Nemoto M, Nomura Y, Sato C, et al. Analysis of optical signals evoked by peripheral nerve stimulation in rat somatosensory cortex: Dynamic changes in hemoglobin concentration and oxygenation. Journal. of. Cerebral. Blood. Flow. & Metabolism 19(1), 246 (1999).
- Müller M, Somjen GG. Intrinsic optical signals in rat hippocampal slices during hypoxia-induced spreading depression-like depolarization. Journal. Of. Neurophysiology 82(1), 1818-1831(1999).
- Chen S, Feng Z, Li P, et al. In vivo optical reflectance imaging of spreading depression waves in rat brain with and without focal cerebral ischemia 11(1), 34002 (2006).
- Bere Z, Obrenovitch TP, Bari F, et al. Ischemia-induced depolarizations and associated hemodynamic responses in incomplete global forebrain ischemia in rats. Neuroscience 260(1), 217-226 (2014).
- Chen S, Li P, Luo W, et al. Origin sites of spontaneous cortical spreading depression migrated during focal cerebral ischemia in rats. Neuroscience. Letters 403(1), 266-270 (2006).
- Bere Z, Obrenovitch TP, Kozak G, et al. Imaging reveals the focal area of spreading depolarizations and a variety of hemodynamic responses in a rat microembolic stroke model. J. Cereb. Blood. Flow. Metab 34(1), 1695-1705 (2014).
- Tuckwell HC, Ricciardi LM, Buonocore A, et al. Mathematical modeling of spreading cortical depression: Spiral and reverberating waves. AIP. Conference. Proceedings 1028(1), 46 (2008).
- Kaufmann D, Theriot JJ, Zyuzin J, et al. Heterogeneous incidence and propagation of spreading depolarizations. Journal. Of. Cerebral. Blood. Flow. & Metabolism. Official. Journal. Of. the. International. Society. Of. Cerebral. Blood. Flow. & Metabolism 0271678X16659496 (2016).
- Santos E, Sánchez-Porras R, Sakowitz OW, et al. Heterogeneous propagation of spreading depolarizations in the lissencephalic and gyrencephalic brain. Journal. Of. Cerebral. Blood. Flow. & Metabolism. Official. Journal. Of. the. International. Society. Of. Cerebral. Blood. Flow. & Metabolism 271678X16689801 (2017).
- P T, A D, S S, et al. Monte carlo simulation of the spatial resolution and depth sensitivity of two-dimensional optical imaging of the brain. Journal. Of. Biomedical. Optics. 16(1), 016006 (2011)
- Schuett S, Bonhoeffer T, Hübener M. Mapping retinotopic structure in mouse visual cortex with optical imaging. Journal. Of. Neuroscience. The. Official. Journal. Of. the. Society. For. Neuroscience 22(1), 6549-6559 (2002).
- Kalatsky VA, Stryker MP. New paradigm for optical imaging: Temporally encoded maps of intrinsic signal. Neuron 38(1), 529-545 (2003).
- Zepeda A, Arias C, et al. Optical imaging of intrinsic signals: Recent developments in the methodology and its applications. Journal. Of. Neuroscience. Methods136(1), 1 (2004).
