Research Article - (2019) Volume 9, Issue 1
Alteration of Red Nucleus Microstructure in Depressive Bipolar II Disorder and Unipolar Depression: A Diffusion Kurtosis and Perfusion Imaging Study
- Corresponding Authors:
- Huang Li
Medical Imaging Center, First Affiliated Hospital of Jinan University, Guangzhou 510630, China
Tel: +86 20 38688989
Fax: +86 20 85228523
Ying Wang
Clinical Experimental Center, First Affiliated Hospital of Jinan University, Guangzhou 510630, China
Tel: +86 20 38688071
Fax: +86 20 85228523
Abstract
Introduction
The red nucleus is an important node of the prefrontal-thalamic-cerebellar circuit, which is related to both cognitive and affective functions. However, the structural and functional changes of the red nucleus in depressive bipolar II disorder (BD-II) or unipolar depression (UD) have rarely been studied.
Methods
Thirty-five patients with depressive BD-II, 29 patients with UD, and 40 healthy controls underwent diffusion kurtosis imaging (DKI) and three-dimensional arterial spin labeling (3D ASL). Region-of-interest analysis was performed to measure the mean kurtosis (MK), axial kurtosis (Ka), radial kurtosis (Kr), fractional anisotropy (FA), mean diffusivity (MD), axial diffusivity (Da), radial diffusivity (Dr), and cerebral blood flow (CBF) in the red nucleus. Multivariate analysis of variance (MANOVA) with Bonferroni pairwise comparison tests was performed to compare the DKI parameters and CBF values of the ROIs among patients with depressive BD-II, patients with UD, and HCs, in the left and right red nucleus respectively; Pearson correlation coefficients were then used to assess whether the clinical variables for the patients correlated with their measured DKI or 3D ASL parameters.
Results
Compared with controls, patients with UD exhibited significantly decreased MK and Kr in the left red nucleus; patients with depressive BD-II exhibited significantly decreased MK in the right red nucleus. No significant changes were found in the remaining DKI/3D ASL parameters, and no significant correlations were revealed between the DKI/3D ASL parameters and clinical variables in patients with either depressive BD-II or UD.
Conclusion
The present study suggests that microstructural impairment exists in the red nucleus in patients with depressive BD-II and patients with UD, which may provide new insights into the underlying neurobiological mechanisms of the two disorders.
Keywords
Bipolar disorder, Brain imaging/neuroimaging, Depression, Functional MRI, Mood disorders
Introduction
Bipolar disorder (BD) and unipolar depression (UD) are among the leading causes of disability worldwide, reducing the number of healthy functioning years in individuals who have these illnesses [1-3]. Although BD is characterized by alternating episodes of mania (BD-I)/hypomania (depressive BD-II) and depression, the depressive episodes are the most common mood manifestation of the illness. Therefore, depressive BD-II is often misdiagnosed as major depressive disorder or recurrent UD when characterized only according to depressive symptoms, leading to inadequate treatment, huge medical costs, and poor clinical outcomes [4]. Therefore, differences and similarities in the depressive states within BD and UD remain a focus of continuous research interest [5]. Accumulating evidence suggests widespread structural and functional brain abnormalities are present in patients with BD and patients with UD [6]. However, few neuroimaging studies [7-9] directly comparing the two disorders have been published.
Despite compelling evidence that suggests a variety of neurobiological abnormalities in BD and UD, the precise nature of the pathogenesis underlying the two disorders remains elusive. Previous studies have suggested involvement of the prefrontal-thalamic-cerebellar circuit, which is related to both cognitive and affective functions in schizophrenia [10-12]. Neuroimaging studies indicate similar structural and functional brain abnormalities are present in schizophrenia and BD [13-15]. Nevertheless, minimal attention has been given to the prefrontal-thalamiccerebellar circuit in BD or UD. An important node of this circuit is the red nucleus [16], which is a deep gray matter structure with a highly complicated microstructural composition [17] consisting of densely packed cells and small myelinated axons [18]. It is mainly implicated in motor coordination and movement control; however, its involvement in higher cognitive and affective functions, such as the processing of emotional salience [19], initiation of emotions [20], anticipation of rewards [21], and processing of socio-emotional scenes [22], has also been proposed. Notably, reduced anisotropy has been reported in the superior cerebellar peduncles that project towards the red nucleus, in diffusion tensor imaging (DTI) studies of patients with schizophrenia [23]. A case report revealed secondary mania in a patient with a solitary red nucleus infarct who had no history of psychiatric disorders [24]. Further, during the brain resting state, the red nucleus displayed strong functional coherence with associative prefrontal, orbitofrontal, insular, temporal, and parietal cortices, as well as the thalamus and cerebellum [19]; all of these are important brain regions that are closely related to cognitive and affective functions in BD and UD [8,25-28]. However, no structural or functional neuroimaging studies have investigated changes in the red nucleus in BD or UD patients.
Recently, a relatively new diffusion imaging technique, diffusion kurtosis imaging (DKI), has been introduced and is increasingly being used in human brain studies. Unlike conventional DTI, which is limited to Gaussian diffusion [29,30] DKI characterizes non-Gaussian water diffusion behavior in neural tissues, measures the e xtent of diffusion displacement probability distribution departure from a Gaussian form, and is useful in assessing intravoxel diffusional heterogeneity, which is regarded as a sensitive indicator of tissue microstructural integrity. DKI can provide additional information (beyond that obtained via DTI) that reflects the microstructure of the brain [29,31,32]. In contrast to DTI, DKI is not limited to anisotropic environments, thus permitting the characterization of the microstructural integrity of both gray and white matter, even in the presence of crossing fibers [29]. This sensitivity to gray matter may enhance examination of the microstructural integrity of the red nucleus. Since the introduction of DKI by Jensen et al. [33], it has shown promising preliminary results for several brain diseases, including temporal lobe epilepsy [34], Parkinson disease [35], normal aging1 [7,36], Alzheimer’s disease [37,38], attention-deficit hyperactivity disorder [39], and schizophrenia [40]. However, few studies related to BD and UD have used DKI to evaluate the microstructural integrity of red nucleus.
Several studies [8,41,42] also reported impairment of perfusion in BD or UD and demonstrated that the alteration of cerebral blood flow (CBF) might involve in the neuropathogenesis of the two disorders. The three dimensional arterial spin labeling (3D ASL) perfusion is a noninvasive MR imaging technique for quantitative measuring of tissue perfusion, which uses magnetically labeled arterial blood water protons as an endogenous tracer [43,44]. However, Few studies uses this technique to discuss the perfusion changes of these disorders [45,46]. Our previous crosssectional study [8,47] shows preliminary results uses 3D ASL in cerebellum and basal ganglia in the two disorders.
In the present study, we aimed to investigate putative abnormalities of the red nucleus in depressive BD-II and UD via DKI and 3D ASL. We hypothesized that both depressive BD-II and UD would exhibit microstructural or perfusional abnormalities in the red nucleus, based on previous studies [16,19,23,24]. This study was novel in that it revealed the microstructural integrity of the red nucleus in both disorders, which may help to further elucidate the similarities and differences between depressive BD-II and UD.
Material and Methods
▪ Subjects
Thirty-five patients with depressive BD-II and 29 patients with UD (aged 18–55 years) were recruited from the inpatient unit of the psychiatry department, the First Affiliated Hospital of Jinan University, Guangzhou, China. All participants met the Diagnostic and Statistical Manual of Mental Disorders IV (DSM-IV) criteria, based on the Structured Clinical Interview for DSM-IV Patient Edition [48]. The clinical state of each patient was assessed using the 24-item Hamilton Depression Rating Scale (HDRS) [49] and the Young Mania Rating Scale (YMRS) [50], during the 7-day period prior to the imaging session. Patients with UD were included if they had a 24-item HDRS total score>18. Depressed patients with BD were included if they had an YMRS total score<7, and a 24-item HDRS total score>18. Patients were excluded from the study if they had any other axis-I psychiatric disorders, a history of organic brain syndrome, neurological disorders, mental retardation, cardiovascular diseases, alcohol/ substance abuse, pregnancy, and/or any physical illness. None of the patients had ever undergone electroconvulsive therapy prior to enrollment in the study. At the time of the study, 20 patients in the depressive BD-II group and 23 patients in the UD group were either medication-naïve or had been unmedicated for at least 5 months. The remaining patients with depressive BD-II were actively taking antidepressants (duloxetine or paroxetine), and/or mood stabilizers (lithium or sodium valproate), and/or atypical antipsychotic medications (olanzapine or risperidone). The remaining patients with UD were actively taking antidepressants (duloxetine or paroxetine). The treatment duration for these patients with depressive BD-II and UD was ≤ 6 weeks. Ten of the 35 depressive BD-II patients reported at least a brief history of psychotic symptoms.
Forty healthy controls (HC) were recruited by local advertisements. They were carefully screened through a diagnostic interview, according to the Structured Clinical Interview for DSM-IV Non-patient Edition, to exclude the presence of current or past history of substance abuse/dependence or any mental disorder in them or in first-degree relatives. Further exclusion criteria for HC comprised any history of cerebrovascular disease, past head injury, epilepsy, migraine, hypertension, diabetes, or other types of disorders that potentially affect the central nervous system. All participants were right-handed and were subjected to magnetic resonance imaging (MRI) scanning within 48 h of initial contact. This preliminary study was conducted in accordance with the Declaration of Helsinki (1989) and was approved by the ethics committee of the First Affiliated Hospital of Jinan University, China. All participants were enrolled between January 2013 and May 2014, upon providing written informed consent. Two senior clinical psychiatrists confirmed that all subjects exhibited the ability to consent to participate in the examination.
▪ MRI techniques
Experiments were conducted on a 3-Tesla MRI system (Discovery MR 750 System, GE Healthcare, WI, USA) with an eight-channel phased-array head coil. Subjects were scanned in a supine, head-first position with cushions symmetrically placed on both sides of the head to decrease motion.
The DKI experiments were performed using a twice-refocused spin echo (TRSE) diffusion sequence with 15 different diffusion encoding directions, using an optimized sampling strategy. For each direction, six b-values (b=0, 500, 1000, 1500, 2000 and 2500 s/mm2) were used according to prior literature reports [29,30,33]. Other imaging parameters were as follows: repetition time (TR)=4500 ms; echo time (TE)=106.8 ms; field of view (FOV)=256 × 256 mm2; matrix=128×128; parallel imaging factor of 2 with 24 k-lines used as references; number of averages=2; slice thickness=2 mm; and voxel size 2 × 2 × 2 mm3. The total scan duration for the DKI sequence was 12 min 5 s. 3D ASL was performed using a pseudocontinuous arterial spin labeling (pCASL) period of 1500 ms, with a post-labeling delay time of 1525 ms (TR=4632 ms; TE=10.5ms; FOV=24 × 24 cm2; slice thickness=4 mm). Whole-brain images were obtained with an interleaved 3D stack of spiral fast spin-echo sequence and background suppression. Multiarm spiral imaging was used, with eight arms and 1024 points acquired on each arm. A high level of background suppression was achieved using four separate inversion pulses that were spaced around the pseudo-continuous labeling pulse. The entire process took 4 min 29 s to complete, including proton attenuation. Moreover, a three-dimensional brain volume imaging (3D BRAVO) sequence, covering the entire brain, was used for structural data acquisition with: TR/TE=8.2 ms/3.2 ms; slice thickness=1.0 mm; gap=0 mm; matrix=256×256; FOV=24×24 cm2; NEX=1; flip angle=12º; bandwidth=31.25 Hz; and acquisition time=3 min 45 s. Routine MRI examination images were also collected to exclude anatomic abnormalities (i.e., T1-weighted, T2- weighted, diffusion-weighted MRI, and T2/ fluid-attenuated inversion recovery images). Two experienced radiologists analyzed the routine MRI scans and found no abnormalities.
▪ Data processing
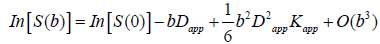
The data were transferred to a dedicated workstation (General Electric Advantage Workstation 4.5), where the DKI and 3D ASL data were post-processed using Functool software [51,52] version 9.4.05a. The Functool program corrected echo planar imaging (EPI) distortion and eddy current. The diffusion and kurtosis tensors were calculated using the DKI model described by Jensen et al. [30,33], which was embedded within the Functool software. The key relationship was as follows:
 (1)
(1)
where S(b) is the signal intensity at the echo time; Dapp is the apparent diffusion coefficient; and Kapp is the apparent diffusion kurtosis. The parameter b is determined by the standard expression 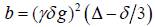 , where γ is the proton gyromagnetic ratio. When performing the expansion of equation [1], b is assumed to vary with the gradient strength g, while the timing parameters δ and Δ remain fixed. Dapp is an estimate for the diffusion coefficient in the direction parallel to the orientation of diffusion-sensitizing gradients; Kapp is an estimate for the diffusion kurtosis in the same direction [33]. Using the DKI protocol, both kurtosis parameters (including mean kurtosis [MK], axial kurtosis [Ka], and radial kurtosis [Kr]) and diffusion parameters (e.g., fractional anisotropy [FA], mean diffusivity [MD], axial diffusivity [Da], and radial diffusivity [Dr]) could be obtained. The DKI-derived estimates of the diffusion indexes (FA, MD, Da, and Dr) are generally more accurate than those obtained using conventional DTI, because of the inclusion of non-Gaussian effects [53]. Details for the computation of these metrics have been described in previous studies [29-31].
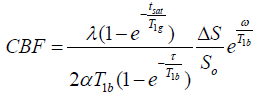
The kinetic model for 3D ASL, as proposed by Alsop and Detre, was used in the present study[54]. Further, a term for finite labeling duration [55] was included, and incomplete recovery of the tissue signal in the reference image [due to the saturation performed tsat (2000 ms)] was corrected before imaging56. Quantitative CBF maps were generated using the following equation [56,57]:
 (2)
(2)
where CBF is the cerebral blood flow; T1b is the T1 relaxation time of the blood (1600 ms) in 3.0 T; T1g represents the T1 relaxation time of the gray matter (1200 ms) in 3.0 T; tsat is the duration of saturation pulse performed before imaging (2000 ms); α is the labeling efficiency (0.8); λ is the brain/blood partition coefficient (0.9); τ is the labeling duration (1500 ms); and ω is the post-labeling delay time (1525 ms). The inversion slab is 22 mm below the acquired volume. Resolution of pCASL data is 3.7 mm (FOV 24 cm; reconstructed matrix: 64 × 64).
Region of interest (ROI)-drawing methods were based on the ROI analyses of Xueying et al. and He et al. [58,59], and were determined by two independent neuroradiologists (LPZ and YW, with 5 and 9 years of experience, respectively) who were blinded to the patient or control status. For each subject, DKI, 3D ASL, and 3D BRAVO images were merged with each other. ROIs were manually placed at the maximum level of the bilateral red nucleus. Considering the relatively low resolution of the DKI and CBF maps, high-resolution 3D BRAVO images and T2- weighted images were selected to merge with the DKI and CBF maps, using DKI and CBF as the reference images. The b0 images (which are essentially T2-weighted images) (Table 1a) and T2-weighted images for the slices with bilateral red nucleus were used to illustrate how and where the ROIs were drawn in DKI and 3D ASL images. First, ROIs were drawn carefully according to the morphology of the red nucleus (hypointense) on the b0 and T2- weighted images. For each subject, ROI sizes were found to be identical in the left and right red nuclei, using the mirror symmetry tools from the Functool software. However, the size of the red nucleus differed among the subjects; thus, the ROIs were not identical. The area of the red nucleus ranged from 55 to 79 mm2. Major vascular structures and artifacts were avoided in placing the ROIs. All ROIs of DKI parameters were then transferred to the maps of MK, Ka, Kr, FA, MD, Da and Dr (Table 1b–h), while the ROIs of 3D ASL were transferred to the maps of CBF (Table 1i) for measurement.
| BD-II | UD | HC | Statistic | ||
|---|---|---|---|---|---|
| n=35 | n=29 | n=40 | |||
| Gender(male/female) | 18/17 | 12/17 | 21/19 | χ2=0.953 | P=0.621 |
| Age(years) | 30.31(10.07) | 33.41(9.05) | 32.50(12.21) | F=0.719 | P=0.490 |
| Education(years) | 13.31(3.20) | 13.17(3.01) | 14.43(3.34) | F=1.553 | P=0.217 |
| Duration of illness(months) | 41.77(39.56) | 35.30(48.74) | n/a | t=0.591 | P=0.556 |
| Age of illness Onset(years) | 25.78(9.11) | 28.96(7.17) | n/a | t=1.693 | P=0.095 |
| HDRS-24 score (points) | 25.73(5.36) | 24.81(5.27) | n/a | t=-0.446 | P=0.657 |
| YMRS score (points) | 2.68(1.15) | 2.13(1.15) | n/a | t=-1.887 | P=0.063 |
| Number of past manic/depressive episodes | 2.02(2.01) | 3.08(5.85) | n/a | n | n |
ABB: BD-II: Bipolar II Disorder; UD: Unipolar Depression; HC: Healthy Controls; HDRS: Hamilton Depression Rating Scale; YMRS: Young Mania Rating Scale.
Table 1: The characteristics of the participants.
▪ Statistical analysis
Statistical analyses were performed using SPSS for Windows software, version 17.0 (SPSS Inc., IL, USA). Distributions of age and years of education among the three groups were compared using one-way analysis of variance. The chi-squared test was used to compare gender distributions. Multivariate analysis of variance (MANOVA) with Bonferroni pairwise comparison tests was performed to compare the DKI parameters and CBF values of the ROIs among depressive BDII, UD, and HC groups in the left and right red nuclei, as well as among the unmedicated depressive BD-II (n=20), UD (n=23), and HC (n=40) subjects; it was then adjusted for age, with sex and group as fixed factors. Pearson correlation coefficients were used to assess the correlation between patient clinical variables and their DKI/3D ASL parameters, as well as to assess the correlation between the size of the red nucleus and the DKI/3D ASL parameters. Asymmetry indexes were calculated using the formula (R − L)/(R + L) × 100 36, for the direct evaluation of lateralization of each DKI- and 3D ASL-generated parameter among the three groups. Inter-rater reliability was assessed using the intraclass correlation coefficient (ICC) analysis. A P-value of < 0.05 was considered to be statistically significant.
Results
▪ Participant characteristics
Table 1 shows the characteristics and clinical data of all study participants. No significant differences were noted among the three groups regarding the age, gender, or education levels of the subjects. The two depressed groups were matched for severity of depression, duration of illness, and age of illness onset.
▪ Inter-rater reliability analysis
The ICC analysis revealed a significantly high α value, which was > 0.70 in the ROIs; the ICC value was approximately 1 (P < 0.05). Hence, all measurements were regarded as reliable among different raters (Table 2) and average values were used for subsequent statistical analyses.
| RN | MK | Ka | Kr | FA | MD | Da | Dr | CBF | ||||||||
|---|---|---|---|---|---|---|---|---|---|---|---|---|---|---|---|---|
| L | R | L | R | L | R | L | R | L | R | L | R | L | R | L | R | |
| α | 0.964 | 0.978 | 0.934 | 0.926 | 0.976 | 0.966 | 0.976 | 0.965 | 0.962 | 0.965 | 0.954 | 0.973 | 0.972 | 0.978 | 0.973 | 0.970 |
| ICC | 0.931 | 0.957 | 0.876 | 0.862 | 0.954 | 0.934 | 0.950 | 0.931 | 0.916 | 0.920 | 0.913 | 0.946 | 0.934 | 0.950 | 0.949 | 0.942 |
| P | 0.000 | 0.000 | 0.000 | 0.000 | 0.000 | 0.000 | 0.000 | 0.000 | 0.000 | 0.000 | 0.000 | 0.000 | 0.000 | 0.000 | 0.000 | 0.000 |
Table 2: Inter-rater reliability of DKI and 3D ASL parameters in the red nucleus.
▪ Group differences in the parameters generated from DKI
Table 3 presents the DKI parameters of the three groups (Figure 2a-n). MANOVA revealed significant differences in MK and Kr among the three groups. Pairwise comparisons revealed that the UD group exhibited significantly decreased MK (P=0.015, Bonferroni-corrected) and Kr (P=0.048, Bonferroni-corrected) in the left red nucleus, compared with the HC group. The depressive BD-II group solely exhibited significantly decreased MK (P=0.030, Bonferroni-corrected) in the right red nucleus, compared with the HC group. No significant changes were observed in the remaining DKI parameters (in the ROIs) among the three groups. The results of comparisons of the DKI parameters between unmedicated patients with depressive BD-II (n=20) or with UD (n=23), and comparisons of these patients’ parameters with those of HC (n=40) subjects, are included in the supplemental information (Table S1).

Figure 1a-i: ROIs of the red nucleus on axial b0 image. (b-h) ROIs of the red nucleus on corresponding MK, Ka, Kr, FA, MD, Da, Dr map. (i) ROIs of the red nucleus on CBF map which merged with T2-weighted image.

Figure 2a-p: group differences of the parameters generated from DKI in the left and right red nucleus respectively. * P < 0.05.
ABB: MK: mean kurtosis; Ka: axial kurtosis; Kr: radial kurtosis; FA: fractional anisotropy; MD: mean diffusivity; Da: axial diffusivity; Dr: radial diffusivity; BD: bipolar disorder; UD: unipolar depression; HC: healthy controls.
The units for MD, Da and Dr are all μm2/ms; MK, Ka, Kr and FA are dimensionless parameters.
| Side | Group | Manova | Pairwise comparisons (P value) | ||||||
|---|---|---|---|---|---|---|---|---|---|
| BD-II(n=35) | UD(n=29) | HC(n=40) | F | P | UD vs BD-II | UD vs HC | BD-II vs HC | ||
| Red nucleus | |||||||||
| MK | left | 1.04(0.07) | 1.02(0.07) | 1.07(0.06) | 4.401 | 0.015 | 0.651 | 0.015* | 0.180 |
| right | 1.03(0.08) | 1.02(0.09) | 1.06(0.06) | 3.858 | 0.024 | 0.998 | 0.144 | 0.030* | |
| Ka | left | 0.83(0.05) | 0.80(0.05) | 0.82(0.05) | 1.068 | 0.347 | 0.457 | 1.000 | 1.000 |
| right | 0.82(0.05) | 0.82(0.05) | 0.82(0.04) | 0.073 | 0.930 | 1.000 | 1.000 | 1.000 | |
| Kr | left | 1.33(0.19) | 1.26(0.20) | 1.38(0.20) | 3.001 | 0.054 | 0.388 | 0.048* | 0.857 |
| right | 1.29(0.21) | 1.28(0.21) | 1.38(0.18) | 2.758 | 0.068 | 1.000 | 0.166 | 0.138 | |
| FA | left | 0.39(0.06) | 0.39(0.05) | 0.40(0.06) | 0.106 | 0.421 | 1.000 | 1.000 | 1.000 |
| right | 0.40(0.05) | 0.39(0.05) | 0.40(0.06) | 0.096 | 0.909 | 1.000 | 1.000 | 1.000 | |
| MD | left | 0.89(0.05) | 0.90(0.07) | 0.90(0.04) | 0.344 | 0.710 | 1.000 | 1.000 | 1.000 |
| right | 0.90(0.06) | 0.90(0.06) | 0.90(0.04) | 0.264 | 0.769 | 1.000 | 1.000 | 1.000 | |
| Da | left | 1.29(0.09) | 1.30(0.14) | 1.29(0.09) | 0.191 | 0.826 | 1.000 | 1.000 | 1.000 |
| right | 1.30(0.09) | 1.30(0.12) | 1.31(0.10) | 0.130 | 0.878 | 1.000 | 1.000 | 1.000 | |
| Dr | left | 0.70(0.06) | 0.70(0.06) | 0.70(0.05) | 0.368 | 0.693 | 1.000 | 1.000 | 1.000 |
| right | 0.70(0.06) | 0.71(0.06) | 0.70(0.05) | 0.260 | 0.772 | 1.000 | 1.000 | 1.000 | |
The units for MD, Da and Dr are all μm2/ms; MK, Ka, Kr and FA are dimensionless parameters.
ABB: DKI: Diffusion Kurtosis Imaging; MK: Mean Kurtosis; Ka: Axial Kurtosis; Kr: Radial Kurtosis; FA: Fractional Anisotropy; MD: Mean Diffusivity; Da: Axial Diffusivity; Dr: Radial Diffusivity; BD-II : Bipolar II Disorder; UD: Unipolar Depression; HC: Healthy Controls.
Table 3: Comparison of DKI parameters in the red nucleus in patients with depressive BD-II, UD and HC subjects.
▪ Group differences in CBF
Table 4 presents the results of CBF in depressive BD-II, UD, and HC groups (Figure 2o-p). MANOVA and pairwise comparisons revealed that there were no significant changes in CBF in the bilateral red nucleus among the three groups. The results of comparisons of CBF between unmedicated patients with depressive BD-II (n=20) or with UD (n=23), and comparisons of these patients’ parameters with those of HC (n=40) subjects, are included in the supplemental information (Table S2).
| Side | Group | Manova | Pairwise comparisons (P value) | ||||||
|---|---|---|---|---|---|---|---|---|---|
| BD-II(n=35) | UD(n=29) | HC(n=40) | F | p | UD vs BD-II | UD vs HC | BD-II vs HC | ||
| CBF of Red nucleus | left | 50.88(9.56) | 51.72(8.19) | 54.37(9.32) | 1.763 | 0.176 | 1.000 | 0.681 | 0.212 |
| right | 49.92(9.66) | 50.28(8.78) | 53.28(9.89) | 1.619 | 0.202 | 1.000 | 0.570 | 0.284 | |
ABB: CBF: Cerebral Blood Flow; BD-II: Bipolar II Disorder; UD: Unipolar Depression; HC: Healthy Controls.
The unit for CBF is ml/100 g/min.
Table 4: Comparison of the CBF from 3D ASL in the red nucleus in patients with depressive BD-II, UD and HC subjects.
▪ Group differences of the asymmetry index of DKI and 3D ASL parameters
Table 5 reveals that there were no significant differences in the asymmetry index of each DKIor 3D ASL-generated parameter among the three groups.
| group | ANOVA | Post hoc Bonferroni corrected p value | ||||||
|---|---|---|---|---|---|---|---|---|
| BD-II(n=35) | UD(n=29) | HC(n=40) | F | p | UD vs BD-II | UD vs HC | BD-II vs HC | |
| Red nucleus | ||||||||
| MK | -0.95(2.59) | 0.06(2.77) | -0.32(2.06) | 1.432 | 0.243 | 0.335 | 1.000 | 0.729 |
| Ka | -0.67(3.16) | 0.71(3.03) | 0.21(3.34) | 1.581 | 0.211 | 0.290 | 1.000 | 0.634 |
| Kr | -1.75(5.44) | 0.90(5.28) | 0.12(3.77) | 2.780 | 0.067 | 0.100 | 1.000 | 0.229 |
| FA | 0.02(0.06) | 0.00(0.06) | 0.00(0.05) | 0.657 | 0.520 | 1.000 | 1.000 | 0.851 |
| MD | 0.02(0.00) | 0.00(0.02) | 0.00(0.02) | 0.259 | 0.772 | 1.000 | 1.000 | 1.000 |
| Da | 0.01(0.03) | 0.00(0.03) | 0.01(0.03) | 0.248 | 0.781 | 1.000 | 1.000 | 1.000 |
| Dr | -0.00(0.03) | 0.00(0.03) | 0.01(0.03) | 0.552 | 0.577 | 1.000 | 1.000 | 0.919 |
| CBF | -0.95(4.25) | -1.58(4.27) | -1.12(2.09) | 0.284 | 0.753 | 0.896 | 0.930 | 0.993 |
ABB: DKI: Diffusion Kurtosis Imaging; MK: Mean Kurtosis; Ka: Axial Kurtosis; Kr: Radial Kurtosis; FA: Fractional Anisotropy; MD: Mean Diffusivity; Da: Axial Diffusivity; Dr: Radial Diffusivity; CBF: Cerebral Blood Flow; BD-II: Bipolar II Disorder; UD: Unipolar Depression; HC: Healthy Controls.
The Units For MD, Da And Dr Are All Μm2/Ms; MK, Ka, Kr And FA Are Dimensionless Parameters.
Table 5: Comparison of the asymmetry index of DKI parameters in the red nucleus in patients with depressive BD-II, UD and HC.
Correlation analysis
No significant correlations were observed between the DKI/3D ASL parameters in the bilateral red nucleus and the clinical variables (HDRS scores and illness duration) in the patients with either depressive BD-II or UD; moreover, no significant correlations were observed between the DKI/3D ASL parameters and the size of the bilateral red nucleus (Table S3 and Table S4 in the supplemental information).
Discussion
The present study was novel in that it directly compared the differences and similarities in the microstructural organization of the red nucleus among depressive BD-II patients, UD patients, and HC subjects, using DKI and 3D ASL. The principal finding of this study was that patients with UD exhibited microstructural abnormalities in the left red nucleus and patients with depressive BD-II exhibited microstructural abnormalities in the right red nucleus.
In the current study, MK and Kr in the left red nucleus in the UD group, as well as MK in the depressive BD-II group, were reduced compared with those in the HC group; this indicates the impairment of the red nucleus in these diseases. In DKI, MK is a dimensionless parameter that reflects the average degree of diffusion restriction, whereas Ka and Kr measure the kurtoses along directions that are respectively parallel and perpendicular to the principal diffusion direction [51]. MK is regarded as an index of tissue-microstructure complexity, which includes density, orientation, and degree of cell membrane organization, axon sheaths, and myelin layers [51]. A lower MK value suggests a loss of microstructural integrity [40], while a lower Kr value may reflect myelin injury [39,60]. Reduction of MK in BD-II and UD patients in the present study implied that the water diffusion in the red nucleus of the patients was less restricted than in the red nucleus of the HCs; further, it indicated a reduced microstructure complexity, which may be a result of the impairment of barrier cell structures in these areas. These processes, together with demyelination, may result in more free water diffusion in the radial direction; hence, a lower Kr [31,51] was observed in the left red nucleus in the UD group.
Interestingly, MK decreased significantly in the left red nucleus in the UD group, while it decreased significantly in the right red nucleus in the depressive BD-II group. Many previous studies have reported a certain degree of asymmetry in various parameters of BD or UD. For example, disrupted asymmetry of temporal lobe function was revealed by magnetoencephalography [36] in BD patients; the cerebral perfusion [61] and the magnetization transfer ratio [62] both showed an asymmetric pattern in these patients. However, the present study revealed that the asymmetry index of each parameter that was generated by DKI and 3D ASL, using the formula (R − L)/(R + L) × 100, did not differ among depressive BD-II, UD, and HC groups. Therefore, no significant difference was observed in the asymmetry among the three groups. Consistent with the present results, a recent resting-state fMRI study by Gunther et al. [63] also found that individuals high in social anhedonia demonstrated enhanced activation solely in the left red nucleus (as in our present UD results) in response to masked sad faces, relative to individuals low in social anhedonia; however, the mechanism was still unclear. Interestingly, the case report of secondary mania in a patient with solitary red nucleus infarction involved damage solely in the right red nucleus [24] (consistent with the present results of depressive BD-II). However, the present results should be interpreted with caution because there is still insufficient evidence to distinguish the different roles of the left and right red nucleus in UD and depressive BD-II. It is noTable that microstructural impairment was detected in the red nucleus in the individuals with depression (including depressive BD-II and UD). We will further verify these results in larger samples, using multiple neuroimaging techniques, in future studies.
However, 3D ASL revealed no significant changes in CBF in the bilateral red nucleus among the three groups. Thus far, few studies have used structural neuroimaging combined with functional techniques to analyze BD or UD patients, and the relationship between microstructural changes and the blood flow of the red nucleus remains unclear; this lack of clarity may be a result of functional compensation after initial microstructure impairment. However, further studies are needed to confirm this speculation. No significant correlations were found between the DKI/3D ASL parameters in the bilateral red nucleus and the clinical variables (HDRS scores and illness duration) in patients with either depressive BD-II or UD; moreover, no significant correlations were found between the DKI/3D ASL parameters and the size of bilateral red nucleus. In summary, the findings of the present study provide further evidence for the involvement of red nucleus impairment in the pathophysiology of depressive BD-II and UD, and may potentially provide new insights into underlying neurobiological mechanisms of the two disorders. Further histological and imaging studies are needed to unveil the exact underlying mechanism.
The present pilot study had several limitations. First, the number of participants was small, although it was larger than the number of participants in many previous studies. Subtle differences between groups might have been detected with a larger sample size. Second, some patients included in the study were undergoing medication therapy prior to MRI scanning. Studies using patients who are newly diagnosed with depressive BD-II and UD (i.e., without medication) would be useful to exclude the effects of medication on the results. Third, the ROIs on the red nucleus were drawn manually, and the reproducibility of measurements was unclear. However, the ROIs were drawn by two of the authors, the rater bias was largely prevented by blinding, and the interclass correlation coefficients were 0.862–0.957. Fourth, the current study has not been stratified by age because of the small sample size. Aging may have effects on the red nucleus, such as volume reduction, increase of iron concentration [64], and higher microstructural complexity [17]. However, we matched the ages of the patient and control groups. In addition, age was used as a covariate in the statistical process to minimize the effect of age on the results. Fifth, because DKI demands high-b-value diffusion-weighted images, it is sensitive to noise. Consequently, the resolution of the acquired images was suboptimal to sustain sufficiently high signal-to-noise ratios and minimize the acquisition time. This might have led to partial volume effects, which could have reduced the sensitivity of the analysis. Sixth, in 3D ASL, only one post-labeling delay time (1525 ms) in pCASL was used, which might have influenced the evaluation of cerebral blood flow in some cases [52]. Seventh, multiple comparisons were used in the statistical analysis, which might increase the probability of the type I error. Therefore, further studies are needed to verify the present results. Finally, the present study was a cross-sectional study, although the patients with UD had no family history of BD. In the absence of longitudinal data, whether some patients might later be diagnosed with BD was not known.
In conclusion, the present study suggests that microstructural impairment in the red nucleus exists in BD-II and UD during the depressive period, which may provide new insights into the underlying neurobiological mechanisms of the two disorders.
Abbreviations
Da: Axial diffusivity; Ka: axial kurtosis; BD: bipolar disorder; CBF: cerebral blood flow; DSM-IV: Diagnostic and Statistical Manual of Mental Disorders IV; DKI: diffusion kurtosis imaging; DTI: diffusion tensor imaging: TE: echo time; FOV: field of view; FA: fractional anisotropy; HDRS: Hamilton Depression Rating Scale; HC: healthy controls; BD-II: hypomania depressive; ICC: intraclass correlation coefficient; MRI: magnetic resonance imaging; BD-I: mania; MD: mean diffusivity; MK: mean kurtosis; MANOVA: multivariate analysis of variance; pCASL: pseudocontinuous arterial spin labeling; Dr: radial diffusivity; Kr: radial kurtosis; ROI: region of interest; TR: repetition time; 3D ASL: threedimensional arterial spin labeling; 3D BRAVO: three-dimensional brain volume imaging; TRSE: twice-refocused spin echo; UD: unipolar depression; YMRS: Young Mania Rating Scale.
Conflict of Interest
The authors declare no Conflict of Interest.
Acknowledgments
This study was supported by the National Natural Science Foundation of China (81671670, 81501456, 81860306); the Planned Science and Technology Project of Guangzhou, China (201604020007, 201604020184, 201508020004); the Foundation of Gansu Provincial Hospital (17GSSY4-5). The funding organizations played no further role in the study design, data collection, analysis and interpretation, or the paper writing.
References
- Redlich R, Almeida JJR, Grotegerd D, et al. Brain morphometric biomarkers distinguishing unipolar and bipolar depression: A voxel-based morphometry-pattern classification approach. Jama. Psychiatry 71(11), 1222-1230 (2014).
- Brundtland GH. From the World Health Organization. Mental health: new understanding, new hope. Jama 286(19), 2391 (2001).
- Kupfer DJ. The increasing medical burden in bipolar disorder. Jama 293(20), 2528-2530 (2005).
- Bowden CL. Diagnosis, treatment, and recovery maintenance in bipolar depression. J. Clin. Psychiatry 71(1), e01 (2010).
- Dervic K, Garcia-Amador M, Sudol K, et al. Bipolar I and II versus unipolar depression: Clinical differences and impulsivity/aggression traits. Euro. Psychiatry 30(1), 106-113 (2015).
- Kempton MJ, Salvador Z, Munafo MR, et al. Structural neuroimaging studies in major depressive disorder. Meta-analysis and comparison with bipolar disorder. Arch. Gen. Psychiatry 68(7), 675-690 (2011).
- Wang Y, Zhong S, Jia Y, et al. Interhemispheric resting state functional connectivity abnormalities in unipolar depression and bipolar depression. Bipolar. disorders 17(5), 486-495 (2015).
- Zhao L, Wang Y, Jia Y, et al. Cerebellar microstructural abnormalities in bipolar depression and unipolar depression: A diffusion kurtosis and perfusion imaging study. J. Affec. disorders 195(1), 21-31 (2016).
- Wise T, Radua J, Nortje G, et al. Voxel-based meta-analytical evidence of structural disconnectivity in major depression and bipolar disorder. Biolo. Psychiatry 79(4), 293-302 (2016).
- Honey GD, Pomarol-Clotet E, Corlett PR, et al. Functional dysconnectivity in schizophrenia associated with attentional modulation of motor function. Brain. J. Neurol 128(11), 2597-2611 (2005).
- Parker KL, Andreasen NC, Liu D, et al. Eyeblink conditioning in unmedicated schizophrenia patients: a positron emission tomography study. Psychiatry. Res 214(3), 402-409 (2013).
- Rusch N, Spoletini I, Wilke M, et al. Prefrontal-thalamic-cerebellar gray matter networks and executive functioning in schizophrenia. Schizophrenia. Research 93(1-3), 79-89 (2007).
- Rimol LM, Hartberg CB, Nesvag R, et al. Cortical thickness and subcortical volumes in schizophrenia and bipolar disorder. Biolo. Psychiatry 68(1), 41-50 (2010).
- Nieto RG, Castellanos FX. A Meta-analysis of neuropsychological functioning in patients with early onset schizophrenia and pediatric bipolar disorder. J. Clin. Child. Adol. Psychology 40(2), 266-280 (2011).
- Hartberg CB, Sundet K, Rimol LM, et al. Subcortical brain volumes relate to neurocognition in schizophrenia and bipolar disorder and healthy controls. Prog. Neuropsychopharmacology Biol. Psychiatry 35(4), 1122-1130 (2011).
- Andreasen NC, Paradiso S, O'Leary DS. "Cognitive dysmetria" as an integrative theory of schizophrenia: a dysfunction in cortical-subcortical-cerebellar circuitry?. Schizophrenia. Bull 24(2), 203-218 (1998).
- Gong NJ, Wong CS, Chan CC, et al. Aging in deep gray matter and white matter revealed by diffusional kurtosis imaging. Neurobiol. Aging 35(10), 2203-2216 (2014).
- Onodera S, Hicks TP. A comparative neuroanatomical study of the red nucleus of the cat, macaque and human. PloSone 4(8), e6623 (2009).
- Nioche C, Cabanis EA, Habas C. Functional connectivity of the human red nucleus in the brain resting state at 3T. AJNR. Am. J. Neuroradiol 30(2), 396-403 (2009).
- Damasio A, Carvalho GB. The nature of feelings: evolutionary and neurobiological origins. Nat. Revi. Neurosci 14(2), 143-152 (2013).
- Yan C, Yang T, Yu QJ, et al. Rostral medial prefrontal dysfunctions and consummatory pleasure in schizophrenia: a meta-analysis of functional imaging studies. Psychiatry. Res 1(3), 187-196 (2015).
- Van den Stock J, Hortensius R, Sinke C, et al. Personality traits predict brain activation and connectivity when witnessing a violent conflict. Sci. Rep 4(5), 13779 (2015).
- Magnotta VA, Adix ML, Caprahan A, et al. Investigating connectivity between the cerebellum and thalamus in schizophrenia using diffusion tensor tractography: a pilot study. Psychiatry. Res 163(3), 193-200 (2008).
- Lee YM. Secondary mania in a patient with solitary red nucleus lesion. Psychiatry. Clin. Neurosci 68(3), 243-243 (2014).
- Cheng YQ, Xu J, Chai P, et al. Brain volume alteration and the correlations with the clinical characteristics in drug-naive first-episode MDD patients: a voxel-based morphometry study. Neurosci. Let 480(1), 30-34 (2010).
- Lorenzetti V, Allen NB, Fornito A, et al. Structural brain abnormalities in major depressive disorder: a selective review of recent MRI studies. J. Aff. Disorders 117(1-2), 1-17 (2009).
- Dell'Osso B, Cinnante C, Di Giorgio A, et al. Altered prefrontal cortex activity during working memory task in Bipolar Disorder: A functional Magnetic Resonance Imaging study in euthymic bipolar I and II patients. J. Aff. Disorders 184(1), 116-122 (2015).
- Womer FY, Wang L, Alpert KI, et al. Basal ganglia and thalamic morphology in schizophrenia and bipolar disorder. Psychiatry. Res. Neuroimag 223(2), 75-83 (2014).
- Lu H, Jensen JH, Ramani A, et al. Three-dimensional characterization of non-gaussian water diffusion in humans using diffusion kurtosis imaging. NMR. Biomed 19(2), 236-247 (2006).
- Jensen JH, Helpern JA. MRI quantification of non-Gaussian water diffusion by kurtosis analysis. NMR. Biomed 23(7), 698-710 (2010).
- Hui ES, Cheung MM, Qi L, et al. Towards better MR characterization of neural tissues using directional diffusion kurtosis analysis. NeuroImage 42(1), 122-134 (2008).
- Jensen JH, Falangola MF, Hu C, et al. Preliminary observations of increased diffusional kurtosis in human brain following recent cerebral infarction. NMR, Biomed 24(5), 452-457 (2011).
- Jensen JH, Helpern JA, Ramani A, et al. Diffusional kurtosis imaging: the quantification of non-gaussian water diffusion by means of magnetic resonance imaging. Magn. Reson. Med 53(6), 1432-1440 (2005).
- Bonilha L, Lee CY, Jensen JH, et al. Altered microstructure in temporal lobe epilepsy: A diffusional kurtosis imaging study. AJNR. Am. J. Neuroradiol 36(4), 719-724 (2014).
- Kamagata K, Tomiyama H, Hatano T, et al. A preliminary diffusional kurtosis imaging study of Parkinson disease: comparison with conventional diffusion tensor imaging. Neuroradiology 56(3), 251-258 (2014).
- Wang Y, Feng Y, Jia Y, et al. Absence of auditory M100 source asymmetry in schizophrenia and bipolar disorder: a MEG study. PloSone 8(12), e82682 (2013).
- Bhagwagar Z, Wylezinska M, Jezzard P, et al. Reduction in occipital cortex gamma-aminobutyric acid concentrations in medication-free recovered unipolar depressed and bipolar subjects. Biol. Psychiatry 61(6), 806-812 (2007).
- Wang L, Zou F, Shao Y, et al. Disruptive changes of cerebellar functional connectivity with the default mode network in schizophrenia. Schizophrenia. Res 160(1-3), 67-72 (2014).
- Helpern JA, Adisetiyo V, Falangola MF, et al. Preliminary evidence of altered gray and white matter microstructural development in the frontal lobe of adolescents with attention-deficit hyperactivity disorder: a diffusional kurtosis imaging study. J. Magn. Reson. Imagin. 33(1), 17-23 (2011).
- Zhu J, Zhuo C, Qin W, et al. Performances of diffusion kurtosis imaging and diffusion tensor imaging in detecting white matter abnormality in schizophrenia. NeuroImage Clini 7(1), 170-176 (2015).
- Vardi N, Freedman N, Lester H, et al. Hyperintensities on T2-weighted images in the basal ganglia of patients with major depression: Cerebral perfusion and clinical implications. Psychiatry. Res.Neuroimaging 192(2), 125-130 (2011).
- Ho TC, Wu J, Shin DD, et al. Altered cerebral perfusion in executive, affective, and motor networks during adolescent depression. J. Am. Acad. Child. Adolesc. Psychiatry 52(10), 1076-1091 (2013).
- Abdel Razek AAK, Nada N. Arterial spin labeling perfusion-weighted MR imaging: correlation of tumor blood flow with pathological degree of tumor differentiation, clinical stage and nodal metastasis of head and neck squamous cell carcinoma. Eur. Arch. Otorhinolaryngol 275(5), 1301-1307 (2018).
- Razek A, El-Serougy L, Abdelsalam M, et al. Differentiation of residual/recurrent gliomas from postradiation necrosis with arterial spin labeling and diffusion tensor magnetic resonance imaging-derived metrics. Neuroradiology 60(2), 169-177 (2018).
- Walther S, Hofle O, Federspiel A, et al. Neural correlates of disbalanced motor control in major depression. J. Aff. Disorders 136(1-2), 124-133 (2012).
- Ho TC, Wu J, Shin DD, et al. Altered cerebral perfusion in executive, affective, and motor networks during adolescent depression. J. Am. Acad. Child. Adolesc. Psychiatry 52(10), 1076-1091 (2013).
- Zhao L, Wang Y, Jia Y, et al. Microstructural abnormalities of basal ganglia and thalamus in bipolar and unipolar disorders: a diffusion kurtosis and perfusion imaging study. Psychiatry. Investig 14(4), 471-482 (2017).
- Spitzer RL, Williams JB, Gibbon M, et al. The structured clinical interview for DSM-III-R (SCID). American Psychiatric Press, Washington DC (1994(.
- Hamilton M. Rating depressive patients. J. Clin. Psychiatry 41(1), 21-24 (1980).
- Young RC, Biggs JT, Ziegler VE, et al. A rating scale for mania: reliability, validity and sensitivity. Br. J. Psychiatry 133(1), 429-435 (1978).
- Sun Y, Sun J, Zhou Y, et al. Assessment of in vivo microstructure alterations in gray matter using DKI in internet gaming addiction. Behav. Brain. Funct 10(1), 37 (2014).
- Xiao HF, Chen ZY, Lou X, et al. Astrocytic tumour grading: a comparative study of three-dimensional pseudocontinuous arterial spin labelling, dynamic susceptibility contrast-enhanced perfusion-weighted imaging, and diffusion-weighted imaging. Eur. Radiol 25(12), 3423-3430 (2015).
- Veraart J, Poot DH, Van Hecke W, et al. More accurate estimation of diffusion tensor parameters using diffusion Kurtosis imaging. Magn. Reson. Med 65(1), 138-145 (2011).
- Alsop DC, Detre JA. Reduced transit-time sensitivity in noninvasive magnetic resonance imaging of human cerebral blood flow. J. Cereb. Blood. Flow. Metab 16(6), 1236-1249 (1996).
- Wang J, Zhang Y, Wolf RL, et al. Amplitude-modulated continuous arterial spin-labeling 3.0-T perfusion MR imaging with a single coil: feasibility study. Radiology 235(1), 218-228 (2005).
- Jarnum H, Steffensen EG, Knutsson L, et al. Perfusion MRI of brain tumours: a comparative study of pseudo-continuous arterial spin labelling and dynamic susceptibility contrast imaging. Neuroradiol 52(4), 307-317 (2010).
- Wu B, Lou X, Wu X, et al. Intra- and interscanner reliability and reproducibility of 3D whole-brain pseudo-continuous arterial spin-labeling MR perfusion at 3T. J. Mag. Reso. Imaging 39(2), 402-409 (2014).
- Xueying L, Zhongping Z, Zhoushe Z, et al. Investigation of apparent diffusion coefficient from ultra-high b-values in Parkinson’s disease. Euro.Radiology 25(9), 2593-2600 (2015).
- He N, Ling H, Ding B, et al. Region-specific disturbed iron distribution in early idiopathic Parkinson's disease measured by quantitative susceptibility mapping. Human. Brain. Mapping 36(11), 4407-4420 (2015).
- Cheung MM, Hui ES, Chan KC, et al. Does diffusion kurtosis imaging lead to better neural tissue characterization? A rodent brain maturation study. NeuroImage 45(2), 386-392 (2009).
- Chen G, Bian H, Jiang D, et al. Pseudo-continuous arterial spin labeling imaging of cerebral blood perfusion asymmetry in drug-naive patients with first-episode major depression. Biomed. Rep 5(6), 675-680 (2016).
- Jia Z, Peng W, Chen Z, et al. Magnetization transfer imaging of treatment-resistant depression. Radiology 284(2), 521-529 (2017).
- Gunther V, Zimmer J, Kersting A, et al. Automatic processing of emotional facial expressions as a function of social anhedonia. Psychiatry. Res 270(1), 46-53 (2017).
- Keuken MC, Bazin PL, Backhouse K, et al. Effects of aging on T1, T*2, and QSM MRI values in the subcortex. Brain. Struct. Funct 222(6), 2487-2505 (2017).