Research Article - Neuropsychiatry (2016) Volume 6, Issue 6
A Preliminary Study to discriminate aMCI and dMCI with Multiple Clinical Neuroimaging Characteristics Using Random Forests Classifier
- †Corresponding Author:
- Jiann-Der Lee
Department of Neurosurgery, Chang Gung Memorial Hospital at LinKou
Taoyuan, Taiwan 333; Department of Electrical Engineering
Ming Chi University of Technology
New Taipei City, Taiwan 24301.
Tel: 03-2118800, Ext: 5316
Abstract
In this study, a classification scheme, using the features from resting-state functional MRI (rsfMRI) and voxel-based morphometry (VBM), was proposed to discriminate two subtypes of mild cognitive impairment (MCI): amnestic MCI (aMCI) subtypes and dys executive MCI (dMCI) subtypes. More specifically, this scheme employed random forests (RF) algorithm to classify three study groups i.e., healthy controls (NC), aMCI, and dMCI. With the hybrid framework, the classification accuracy achieves 77.42% (AUC=0.8101) between aMCI and NC, and 82.14% (AUC=0.8473) between dMCI and NC. If comparing two MCI subtypes against each other, the accuracy can reach 79.57% (AUC=0.8410). The preliminary results suggest that pattern matching using the features from multiple modalities can achieve a clinically relevant accuracy for the a priori diagnosis in MCI subtypes.
Keywords
Mild cognitive impairment, Resting state functional magnetic resonance imaging, Functional connectivity, Voxel-based morphometry, Random forests
Introduction
As reported in [1-4], Alzheimer’s disease (AD) is a progressively neuro-degenerative disorder characterized by leading to deficit of cognitive functions, such as memory loss and cognitive degeneration, and behavioral impairment, resulting in declining quality of daily life. Since AD is irreversible and there is no cure, current treatment focuses on lessening its symptoms. Therefore, how to diagnose AD accurately in early stage has become increasingly significant.
Mild cognitive impairment (MCI) is considered as a transitional stage between normal aging and dementia [5]. Early researches focused on MCI patients with predominant memory impairment and the risk for progression to AD [6]. However, recent studies show the prodromal stage of several neuro-degenerative disorders may begin with non-amnestic cognitive decline (e.g. dysexecutive, language, visuospatial) [7]. Hence this degenerative brain disorder can be divided into two categories: amnestic MCI (aMCI) subtypes and dysexecutive MCI (dMCI) subgroups [5]. In Yaffe’s research [8], it is observed that dMCI subtypes were less likely to convert to AD but had higher rates of death over five years than aMCI subgroups because these subgroups will have different etiologies and outcomes. In Huey’s report [9], patients with dMCI were more likely to experience stroke, detected via MRI than patients with aMCI. Additionally, Chao’s study [10] found that aMCI patients would show perfusion abnormalities in the medial parietal cortex, and dMCI patients would show perfusion abnormalities in the frontal cortex. It is, therefore, important to subdivide MCI groups to improve the effects of clinical treatment.
Generally speaking, functional MRI (fMRI) is a neuroimaging technique that is presumed to directly link specific cognitive activity to neurophysiological changes, such as functional cerebral hemodynamics. fMRI studies, based on blood oxygen level dependent (BOLD) contrast, have shown that cognitively intact older individuals that demonstrate a greater degree of activation in many literatures [11-15]. Therefore, it appears that fMRI activation might be predictive of future cognitive decline during the prodromal stages of AD and MCI. The resting state functional MRI (rs-fMRI) of the brain is measured by spontaneous low frequency fluctuations in BOLD signal patterns across anatomical regions. A correlation of these low frequency fluctuating time courses, generated by their spontaneous activity, can be used to establish the degree of functional connectivity between regions. Examination of rs-fMRI connectivity might be an even more useful technique for observing the initial functionally related changes that occur in AD and prior to behavioral manifestations [16-17]. Moreover, interest in rs-fMRI has steadily grown since its inception. Resting state functional connectivity has been shown to exist in a number of brain networks [18-19], has been revealed with data-driven analysis approaches [20-22], and has been found to be consistent across subjects [23]. These fluctuations are consistent with the concept of functional connectivity (FC) defined by Friston et al. [24] and are thought to represent alterations in blood flow and oxygenation caused by spontaneous neuronal activity [25]. Several recent studies have shown changes in low-frequency correlations for patients in pathological states, inclusive of AD [26,27]. Therefore, in this study, rs-fMRI can reflect spontaneous low-frequency fluctuations ( ïüÃÅ0.1 Hz) in BOLD signal and then be used to investigate the functional architecture of the brain by measuring FC [28].
Voxel-based morphometry (VBM) [29-32] is an automated technique that uses statistics to identify differences in brain anatomy between groups of subjects. Thus, it can be employed to infer the presence of atrophy or, less commonly, tissue expansion in subjects with disease. The technique typically uses T1-weighted volumetric MRI scans and essentially performs statistical tests across all voxels in the image to identify volume differences between groups. For example, to identify differences in patterns of regional anatomy between groups of subjects, a series of t tests are performed at every voxel in the image. Regression analyses are then be performed across voxels to assess neuroanatomical correlates of cognitive or behavioral deficits. The technique has been applied to a number of different disorders, contributing to the understanding of how the brain changes in these disorders and how brain changes relate to characteristic clinical features. Therefore, in this study, we also employ VBM to discriminate the abnormal changes between aMCI and dMCI.
In previous studies described as above, whether rs-fMRI or VBM, can both display the differences of region variances and region positions of brain between different ethnic groups. One thing is worth noting that two methods are analyzed and compared in specific data using the statistical approach. In other words, variances of results displayed in these specific cases may not be applicable in all clinical data. To assess the reliability of results, we adopt random forests (RF) [33] for classification. Basically, RF is an ensemble classifier consisting of many decision trees, where the final predicted class for a test example is the mode of the predictions of all individual trees.
In summary, the objectives of this study are as follows:
a) Examining the dysfunctions of brain regions and abnormal changes of FC in different MCI subtypes and normal individuals using rs-fMRI;
b) Evaluating brain atrophy patterns in different MCI subtypes and normal individuals using VBM;
c) Assessing the performance of combining these features (rs-fMRI / VBM / rs-fMRI + VBM) with RF to classify different study groups.
Methods
▪ Study population
All MR image data adopted in this study were provided by Chang Gung Memorial Hospital, Lin-Kou, Taiwan. The degree of clinical severity for each participant was evaluated by experienced clinicians conducted independent semi-structured interviews which included a set of questions regarding the functional status of the participant, along with a standardized neurologic, psychiatric, and health examination. This interview generates an overall Clinical Dementia Rating (CDR) and Mini Mental State Examination (MMSE) score. The whole dataset consists of three groups comprising normal controls (NCs), aMCI and dMCI: 48 NCs (M/ F=26/22), 40 patients with aMCI (M/F=21/19), and 29 patients with dMCI (M/F=14/15). All study subjects gave written informed consent. Demographic information is provided in Table 1.
| Group | Normal control | aMCI | dMCI |
|---|---|---|---|
| Individuals (Male/Female) Mean age (yrs) Education time (yrs) MMSE scores |
48 (26/22) 64.36 ± 6.26 9.54 ± 4.17 28.72 ± 1.03 |
40 (21/19) 67.47 ± 8.53 7.12 ± 4.93 24.93 ± 4.25 |
29 (14/15) 65.62 ± 5.47 9.87 ± 4.58 27.87 ± 0.99 |
| CDR scores | 0.00± 0.00 | 0.50± 0.00 | 0.19± 0.15 |
Table 1: Demographic data and cognitive scores.
▪ MRI data acquisition
The whole-brain structural and functional MRI scans were obtained by a 3-Tesla MR scanner (Magnetom Trio with TIM system, Siemens, Erlangen, Germany). T1-weighted images were acquired by magnetization-prepared 180 degrees radio-frequency pulses and rapid gradientecho (T1-MPRAGE) series. The following imaging parameters were used: repetition time (TR)=2000 ms, echo time (TE)=4.16 ms, and flip angle=9 degrees. The results were represented as a 224 × 256 matrix, and slice thickness=1 mm in 160 slices.
BOLD rs-fMRI data were acquired in four runs lasting four minutes each by means T2*-weighted echo planar imaging (EPI) free induction decay (FID) sequences applying the following parameters: TR=1671 ms, TE=35 ms, matrix size=64×64, field of view (FOV)=256 mm, in-plane voxel size=4 × 4 mm, flip angle=75 degrees, slice thickness=4mm and no gap. Functional volumes consisted of 30 trans-axial slices. All subjects were asked to relax, stay awake, and don’t need to do anything [34].
▪ Diagnostic criteria
The clinical work-up included a thorough medical history, physical examination, and neuropsychological testing. The following four key cognitive domains were assessed: memory, executive function, language, and visuospatial skills. All subjects were screened for the presence of depressive symptoms using either the Hamilton Depression Rating Scale (NC) or the Cornell scale for depression in dementia (aMCI and dMCI). Patients with depression were excluded.
The mini mental state examination (MMSE) and clinical dementia rating (CDR) were used to quantify the severity of symptoms of dementia. aMCI and dMCI patients were diagnosed after an extensive clinical evaluation. The clinical phenotype of MCI was determined according to the criteria by Petersens et al. [5]. Cognitively healthy controls were free of cognitive impairment as judged by clinical assessment, neuropsychological testing, and clinical dementia rating.
▪ Pre-processing of structural and functional MR images
In order to compare the data from several scans and / or research subjects, all the brain images have to be in the same 3D space. In this study, spatial normalization was performed using statistical parametric mapping software (SPM8) [35]. Spatial normalization is a procedure to register a MRI data set to a standard coordinate system [36]. Therefore, each voxel is thus comparable with the other registered MRI or a reference template. The normalization herein was performed by using a 12-parameter affine transform and a Bayesian framework to a T1- weighted MRI template, provided by ICBM, NIH P-20 project [37].
In addition to spatial normalization, EPI volumes were also processed using SPM8 including steps with an order of slice timing correction (the first 10 volumes of each functional time series were excluded from analysis in advance), head motion correction, and spatial smoothing with 8 mm isotropic full-width-at-half-maximum Gaussian kernel.
▪ Image analysis of rs-fMRI
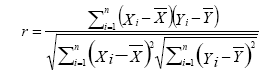
rs-fMRI analysis was performed and the FC was identified using Resting-state fMRI data analysis Toolkit (REST) [38] in this study. In order to obtain required FC, some possible spurious variances (e.g. signals from a region centered in cerebrospinal fluid and white matter, or global signal averaged over whole brain) must be removed using linear regression. Power spectrum of low-frequency signals was collected using temporally band-pass filter (0.01 ~ 0.08 Hz). To get FC maps, Pearson’s correlation coefficient was calculated between residual time series of every seed point in a hemisphere and those of every vertex in the other (target) hemisphere, as shown in Eq. (1).
 (1)
(1)
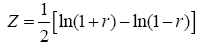
where r is Pearson correlation coefficient, ÃÂÞX and ÃÂÞY are the mean values of time course X and Y, respectively. Seed point is predefined centered at a coordinate [0, -56, 30] within posterior cingulate cortex (PCC) in REST software. Individual Pearson correlation r-maps were converted to normally distributed Z-maps by using Fisher’s Z transformation, as shown in Eq. (2). Finally, all Fisher’s Z-maps were entered into a two-tailed one-sample t-test to detect the regions showing significant FC with PCC.
 (2)
(2)
▪ Image analysis of VBM
In general, VBM used statistic algorithm to identify differences in brain anatomy between different groups of subjects, which in turn can be used to infer the presence of atrophy or tissue expansion in subjects with disease. Here, we adopted VBM to calculate differences in patterns of regional atrophy between groups of NCs, aMCI, and dMCI.
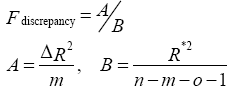
In order to observe the atrophy in gray matter of brain, all T1-weighted images were segmented into gray matter (GM), white matter (WM), and cerebrospinal fluid (CSF) based on the intensity of the image as well as prior probability maps which indicate the likelihood of finding a given tissue class at a given location. General linear model and the theory of Gaussian random fields were adopted in VBM to find the significance in statistics, as shown in Eq. (3).
 (3)
(3)
where n is number of subjects, m is number of voxelwise covariates, o is number of nonvoxelwise covariates, ΔR2 is the difference in the proportion of variance, and R*2 is proportion of total variance.
▪ Specific volume features extraction
In analytic steps of rs-fMRI and VBM, we extract significant differences in brain regions of NCs, aMCI, and dMCI. These results reflect the degree of difference between different ethnic groups in a specific area. In order to increase the discriminative features used in the subsequent classification, FreeSurfer [39] was adopted to segment regions that are equivalent to rs-fMRI and VBM automatically.
▪ Random forests
As shown in Figure 1, Random Forests (RF) [34] is a popular classifier consisting of a collection of tree-structured classifiers R(x, Θk), k=1, 2, 3..., where the Θk are independent identically distributed random vectors and each tree casts a unit vote for the most popular class at input x. The specialty of this combination is that each decision tree is built from a random vector of parameters. Basically, RF algorithm grows many decision trees. To classify a new object from an input vector, the input vector is run down each of the trees in the forest. Each tree gives a classification and each tree votes for the class. In RF, it was shown that the forest error rate depends on two things: correlation and strength. Increasing the correlation increases the forest error rate. On the contrary, increasing the strength of the individual trees decreases the forest error rate. The training set for each individual tree in a random forest is constructed by sampling N examples at random with replacement from the N available examples in the dataset. This is known as bootstrap sampling, and bagging describes the aggregation of predictions from the resulting collection of trees. As a result of the bootstrap sampling procedure, approximately one third of the available N examples are not present in the training set of each tree. These are referred to as the out-of-bag data of the tree, for which internal test predictions can be made. By aggregating the predictions of the out-of-bag data across all trees, an internal estimate of the generalization error of the random forest can be determined.

Figure 1: The operating schema of random forests.
More specifically, at each node in a tree, d << D features are randomly selected, and the node is partitioned using the best possible binary split. RF error rate depends on both the correlation between trees ÃÂÞρ and the strength of the collection of trees s [40], such that an upper bound for the generalization error is given by ÃÂÞρ (1−s2 ) / s2 . A reduction in the selected value of d results in a corresponding reduction in both ÃÂÞρ and s. optimal range for d therefore exists, which is generally quite wide. The recommended default value for most applications is d= [32].
[32].
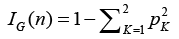
A parent node np is partitioned into child nodes nl and nr according to an impurity criterion which aims to maximize the homogeneity of the child nodes with respect to the parent node. Impurity is assessed using Gini index IG, which measures the likelihood that an example would be incorrectly labeled if it were randomly classified according to the distribution of labels within the node. For two classes C1 and C2, Gini index of a node n may be defined as Eq. (4)
 (4)
(4)
where pk is the relative proportion of examples belonging to class K present in the node n. Therefore, the range of Gini index is from minimum of zero to maximum value of (1-1/K). A value of zero indicates that the node contains only examples belonging to a single class, and the maximum value indicates that the node contains examples belonging to both classes in equal proportions. The best possible binary split is the one which maximizes the improvement in Gini index  . Where pl and pr are the proportions of examples in node np that are assigned to child nodes nl and nr, respectively. The Gini index can also be used to assess the relative importance of the various features for classification. A measure of the importance of an individual feature may be computed by summing the decreases in Gini index ΔIG occurring at all nodes in the forest which are partitioned based on that feature.
In this study, we divided all participants into two classes randomly: a) feature searching class, and b) classified (training-and-test) class. We used the cluster of feature searching to obtain statistical differences of rs-fMRI and VBM between three groups. 30 NCs (M/F=17/13), 30 patients with aMCI (M/F=16/14), and 15 patients with dMCI (M/F=7/8) are included in this cluster. The rest of data are belonging to the cluster of classification. In the experiment, leave-one-out cross-validation (LOOCV) is adopted to estimate dependable generalization error. LOOCV involves using a single observation from the original sample as the validation data, and the remaining observations as the training data. No random factors which will affect the experimental data, to ensure that the experiment can be replicated.
Results and Discussion
▪ Evaluation of rs-fMRI and VBM
aMCI vs. NCs: Figure 2 illustrates the differences of FC and VBM between NCs and aMCI. Table 2 provides a list of the brain regions that have significant discrepancies, where +/- indicates the regions of increased / decreased FC or VBM in aMCI compared with NCs.
| Region | Methods | |
|---|---|---|
| rs-fMRI | VBM | |
| + | Frontal Gyrus - Inferior - Superior |
Frontal Gyrus - Medial - Inferior - Superior - Middle |
| Temporal Gyrus - Superior - Middle |
Temporal Gyrus - Superior - Middle |
|
| Putamen | Putamen | |
| Hypothalamus | Hypothalamus | |
| Declive | Declive | |
| Caudate | ParahippocampaGyrus | |
| - | PostcentralGyrus | |
Table 2: List of significant differences of brain regions (aMCI vs. NCs).

Figure 2: (a) FC differences between aMCI and NCs, (b) VBM differences between aMCI and NCs.
dMCI vs. NCs: Figure 3 illustrates the differences of FC and VBM between NCs and dMCI. Table 3 is the list of the brain regions that have significant discrepancies, where +/- indicates the regions of increased / decreased FC or VBM in dMCI compared with NCs.
| Region | Methods | |
|---|---|---|
| rs-fMRI | VBM | |
| + | Frontal Gyrus - Medial - Superior - Middle |
Frontal Gyrus - Inferior |
| Temporal Gyrus - Superior |
Temporal Gyrus - Superior - Middle |
|
| Putamen | ||
| PostcentralGyrus | ||
| Insula | ||
| Caudate | ||
| - | ParahippocampaGyrus | |
Table 3: List of significant differences of brain regions (dMCI vs. NCs).

Figure 3: (a) FC differences between dMCI and NCs, (b) VBM differences between dMCI and NCs.
aMCI vs. dMCI: Figure 4 illustrates the differences of FC and VBM between aMCI and dMCI. Table 4 provides a list of the brain regions that have significant discrepancies, where +/- indicates the regions of increased / decreased FC or VBM in aMCI compared with dMCI.
| Region | Methods | |
|---|---|---|
| rs-fMRI | VBM | |
| + | Frontal Gyrus - Medial - Inferior |
Frontal Gyrus - Medial - Inferior - Superior - Middle |
| Temporal Gyrus - Superior - Middle |
||
| Declive | ||
| - | Middle Frontal Gyrus | Lingual Gyrus |
| Brodmann area 6 | ||
Table 4: List of significant differences of brain regions (aMCI vs. dMCI).

Figure 4: (a) FC differences between aMCI and dMCI, (b) VBM differences between aMCI and dMCI.
▪ Evaluation of classification
Classified accuracy (ACC), sensitivity (SEN), specificity (SPEC), and area under curve (AUC) were evaluated in the three test sets resulting from the LOOCV strategy as described above. The definition of accuracy, sensitivity and specificity are expressed in Eq. (5) – Eq. (7), where TP=true positive, TN=true negative, FP=false positive, and FN=false negative. Here, we extract the brain regions that have statistically significant differences using rsfMRI and VBM algorithms. Next, we adopt significant regions’ Z-scores and volumes corresponding to regions segmented by FreeSurfer as features, and then assessing the performance of combining these features (rsfMRI / VBM / rs-fMRI + VBM) with random forest decision tree (RF) to classify different testing data. Table 5 is the list of all features we adopted and trained in this study, and the classification results for different types of features are summarized in Table 6.
| Features | ||
|---|---|---|
| rs-fMRI (Z-score) | VBM (F-score) | Volume of tissue |
| Frontal Gyrus - Medial - Inferior - Superior - Middle |
Frontal Gyrus - Medial - Inferior - Superior - Middle |
Frontal Gyrus - Medial - Inferior - Superior - Middle |
| Temporal Gyrus - Superior - Middle |
Temporal Gyrus - Superior - Middle |
Temporal Gyrus - Superior - Middle |
| Putamen | Putamen | Putamen |
| Hypothalamus | Hypothalamus | Hypothalamus |
| Declive | Declive | Declive |
| Caudate | ParahippocampaGyrus | Caudate |
| PostcentralGyrus | Lingual Gyrus | ParahippocampaGyrus |
| Insula | PostcentralGyrus | |
| Lingual Gyrus | ||
| Insula | ||
Table 5: List of all training features.
| Proportion | rs-fMRI | VBM | Volumes | Mixed |
| aMCI from NCs | ||||
| ACC (%) | 72.58 | 67.86 | 65.16 | 77.42 |
| SEN (%) | 71.75 | 70.37 | 69.84 | 82.31 |
| SPEC (%) | 69.35 | 73.05 | 70.61 | 72.00 |
| AUC | 0.7142 | 0.7164 | 0.6898. | 0.8101 |
| dMCI from NCs | ||||
| ACC (%) | 78.57 | 64.27 | 53.57 | 82.14 |
| SEN (%) | 79.62 | 68.02 | 57.69 | 85.19 |
| SPEC (%) | 81.71 | 67.31 | 69.05 | 87.80 |
| AUC | 0.8092 | 0.6714 | 0.5649 | 0.8473 |
| aMCI from dMCI | ||||
| ACC (%) | 77.78 | 62.71 | 62.90 | 79.57 |
| SEN (%) | 75.00 | 65.38 | 69.70 | 83.96 |
| SPEC (%) | 80.93 | 70.81 | 61.02 | 88.24 |
| AUC | 0.7931 | 0.6493 | 0.6466 | 0.8410 |
Table 6: Classification results.
Classified accuracy (ACC), sensitivity (SEN), specificity (SPEC), and area under curve (AUC) were evaluated in the three test sets resulting from the LOOCV strategy as described above. The definition of accuracy, sensitivity and specificity are expressed in Eq. (5) – Eq. (7), where TP=true positive, TN=true negative, FP=false positive, and FN=false negative. Here, we extract the brain regions that have statistically significant differences using rsfMRI and VBM algorithms. Next, we adopt significant regions’ Z-scores and volumes corresponding to regions segmented by FreeSurfer as features, and then assessing the performance of combining these features (rsfMRI / VBM / rs-fMRI + VBM) with random forest decision tree (RF) to classify different testing data. Table 5 is the list of all features we adopted and trained in this study, and the classification results for different types of features are summarized in Table 6.
Accuracy (ACC)=(TP + TN) / (TP + TN + FP + FN) (5)
Sensitivity or true positive rate (TPR)=TP / (TP + FN) (6)
Specificity or True Negative Rate (TNR)=TN / (FP + TN) (7)
Discussion
The resting brain activations in the betweengroup comparisons using REST toolkit are presented in Table 2-4 and Figures 2-4. From experimental results, it is observed that the trend for brain activation in inferior frontal gyri, middle frontal gyri, and temporal gyri were detected, where NCs showed significant increasing. In comparisons of aMCI-dMCI pairs, dMCI patients also displayed same trend for activation in frontal gyri. Because dMCI patients belong to executive function impairments, this result is reasonable that FC is higher than aMCI group. The frontal lobe contains most of the dopamine-sensitive neurons in the cerebral cortex, is associated with working memory tasks and short-term memory tasks. This result also indirectly illustrates that aMCI patients reveal some problems in memory function comparing with NCs and dMCI patients. The dMCI patients did not reveal greater activations in any brain areas when compared to aMCI, but there was a significant decline in Brodmann area 6. Brodmann area 6 is composed of premotor cortex and supplementary motor area (SMA) that is believed to play a role in the planning of complex, coordinated movements. Trend for stronger activation was also detected in postcentral and middle occipital gyri (aMCI vs. NCs). aMCI patients also showed poor activation in hypothalamus, putamen, and caudate, which is also associated memory function. Moreover, dMCI subjects also revealed lower activation in postcentral gyri and insula because they involve in primary motor areas.
Statistical significance of VBM structural results in the between-group comparisons are also presented in Table 2-4 and Figures 2-4. Compared with NCs, aMCI subjects revealed a significant GM volume reduction in frontal gyri, parahippocampa gyri, and related regions in hypothalamus and putamen that controlled memory function. There was a trend towards more atrophy in frontal as well as parietal temporal cortices in MCI subtypes. When compared to dMCI subjects, aMCI patients showed a trend for GM volume loss in temporal cortex. dMCI subjects revealed GM volume loss in lingual gyri. The lingual gyrus is a structure in the visual cortex that plays an important role in the identification and recognition of words. Atrophy in lingual gyri maybe cause difficulty in reading comprehension indirectly (dysexecutive). In comparisons of dMCI-NCs pairs, VBM results displayed GM volume reduction in parahippocampa gyri of NCs. We thought it is mainly due to dMCI patients belong to executive function impairments, not memory function impairments. So atrophy in parahippocampa gyri may not occur.
By combining rs-fMRI (Z-score), VBM (F-score), and volumetric features, the classification accuracy of RF reached to 77.42% (area under curve, AUC=0.8101) and 82.14% (AUC=0.8473) in patients with aMCI and dMCI, respectively. If comparing two MCI subtypes against each other, the accuracy can reach 79.57% (AUC=0.8410). According to the results, combining RF with multi-modality predictors would achieve the best accuracy of classification. Moreover, if just consider ACC and SEN, the identified ability of functional features seems to be better than volume features no matter comparative aMCI and NCs, dMCI and NCs, or aMCI and dMCI. This result also may be explained that the pattern of aMCI or dMCI at early stages followed by a loss of brain activation as cognitive impairment worsens is similar to the pattern seen in individuals with Alzheimer dementia, and functional features have the potential to be detected at early stage before patient’s brain starts apparent atrophy.
Conclusion
In this study, we design a classification framework for image-aided diagnosis in early prodromal Alzheimer’s disease by using rsfMRI and VBM. Based on the experimental results, it is clear that combining rs-fMRI, VBM, and specific volumetric features achieve better MCI classification performance than only individual features used. It is because multiple imaging modalities can provide complementary information to increase the classification accuracy. For the future work, we will increase the size of the dataset to support the outcome of this experiment. In addition, according to the classification results, MCI is apparently similar between normal aging and dementia. Therefore, more features should be investigated to improve the classification performance. For example, DTI can be used to assess the fiber integrity. Electroencephalography (EEG) and cerebrospinal fluid biomarkers can also be added to improve classified accuracy.
This information will help us to improve the outcome of diagnosing neurodegenerative diseases and provide clinically useful information at the large-scale population based screening studies. The results would be helpful for prognosticating disease progression and providing an objective evaluation of cognitive rehabilitation treatments for dementing illness.
Acknowledgment
The work was partly supported by Ministry of Science and Technology, Republic of China, under Grant NSC102-2221-E-182-015- MY3, MOST104-2221-E-182-023-MY2 and Chang Gung Memorial Hospital with Grant No. CMRPD270053, CMRPD2C0041, CMRPD2C0042, CMRPD2C0043.
References
- Simone Brockman, BinuJayawardena, Sergio Starkstein. The diagnosis of depression in Alzheimer’s disease: review of the current literature.Neuropsychiatry1(4), 377-384 (2011).
- Seiju Kobayashi, Takao Ishii, Masaru Tateno,et al.The effect of APOE ε4 allele on brain perfusion SPECT in late onset Alzheimer’s disease by an automated program, 3DSRT. Neuropsychiatry6(2), 55-63 (2016).
- Ferri CP, Brayne C. Global prevalence of dementia: a Delphi consensus study. Lancet.Neurol366(9503), 2112-2117 (2005).
- Lee JD, Yang ST, Wai YY, et al. Probability-based prediction model using multivariate and LVQ-PNN for diagnosing dementia.Neuropsychiatry6(6), 440-450 (2016)
- Petersen RC. Mild cognitive impairment as a diagnostic entity. J. Intern. Med 256(3), 183-194 (2004).
- Petersen RC, Smith GE, Waring SC, et al.Mild cognitive impairment: clinical characterization and outcome. Arch. Neurol56(3), 303-308 (1999).
- Nordlund A, Rolstad S, Hellström P, et al.The Goteborg MCI study: mild cognitive impairment is a heterogeneous condition. J. Neurol. Neurosurg. Psychiatry 76(11), 1485-1490 (2005).
- Yaffe K, Petersen RC, Lindquist K, et al.Subtype of mild cognitive impairment and progression to dementia and death. Dement.Geriatr.Cogn.Disord22(4), 312-319 (2006).
- Huey ED, Manly JJ, Tang MX, et al.Course and etiology of dysexecutive MCI in a community sample. Alzheimers. Dement9(6), 632-639 (2013).
- Chao LL, Pa J, Duarte A, et al.Patterns of Cerebral Hypoperfusion in Amnestic and Dysexecutive MCI. Alzheimer. Dis.Assoc. Disord23(3), 245-252 (2009).
- Bookheimer SY, Strojwas MH, Cohen MS, et al.Trail making test A and B: normative data stratified by age and education. New Eng. J. Med343(1), 450-456 (2000).
- Dickerson BC, Salat DH, Bates JF, et al.Medial temporal lobe function and structure in mild cognitive impairment.Ann. Neurol56(1), 27-35 (2004).
- Li SJ, Li Z, Wu G, et al.Alzheimer Disease: evaluation of a functional MR imaging index as a marker. Radiology225(1), 253-259 (2002).
- Minati L, Chan D, Mastropasqua C, et al.Widespread alterations in functional brain network architecture in amnestic mild cognitive impairment. J. Alzheimers. Dis40(1), 213-220 (2014).
- Teipel SJ, Grothe M, Lista S, et al.Relevance of magnetic resonance imaging for early detection and diagnosis of Alzheimer disease. Med. Clin. North. Am97(3), 399-424 (2013).
- Fleishera AS, Sherzaid A, Taylor C, et al.Resting-state BOLD networks versus task-associated functional MRI for distinguishing Alzheimer's disease risk groups. NeuroImage 47(4), 1678-1690 (2009).
- Rombouts SA, Barkhof F, Goekoop R, et al.Altered resting state networks in mild cognitive impairment and mild Alzheimer's disease: an fMRI study. Hum. Brain. Mapp26(4), 231-239 (2005).
- Cordes D, Haughton VM, Arfanakis K, et al.Frequencies contributing to functional connectivity in the cerebral cortex in "resting-state" data.AJNR. Am. J. Neuroradiol22(7), 1326-1333 (2001).
- Hampson M, Peterson BS, Skudlarski P, et al.Detection of functional connectivity using temporal correlations in MR images. Hum. Brain. Mapp15(4), 247-262 (2002).
- Peltier SJ, Polk TA, Noll DC. Detecting low-frequency functional connectivity in fMRI using a self-organizing map (SOM) algorithm. Hum. Brain. Mapp20(4), 220-226 (2003).
- Beckmann CF, DeLuca M, Devlin JT, et al.Investigations into resting-state connectivity using independent component analysis. Philos. Trans. R. Soc. Lond. B. Biol. Sci360(1457), 1001-1013 (2005).
- Bellec P, Perlbarg V, Jbabdi S, et al.Identification of large-scale networks in the brain using fMRI. NeuroImage29(4), 1231-1243 (2006).
- Damoiseaux JS, Rombouts SA, Barkhof F, et al. Consistent resting-state networks across healthy subjects. Proc. Natl. Acad. Sci. U S A103(37), 13848-13853 (2006).
- Friston KJ, Frith CD, Liddle PF, et al.Functional connectivity: the principal-component analysis of large data sets. J. Cereb. Blood. Flow. Metab 13(1), 05-14 (1993).
- Peltier SJ, Noll DC. T2* dependence of low frequency functional connectivity. NeuroImage 16(4), 985-992 (2002).
- Wang L, Zang Y, He Y, et al.Changes in hippocampal connectivity in the early stages of Alzheimer’s disease: evidence from resting state fMRI. Neuroimage 31(2), 496-504 (2006).
- Greicius MD, Srivastava G, Reiss AL, et al.Default-mode network activity distinguishes Alzheimer’s disease from healthy aging: evidence from functional MRI. Proc. Natl. Acad. Sci. U S A 101(13), 4637-4642 (2004).
- Han Y, Wang J, Zhao Z, et al. Frequency-dependent changes in the amplitude of low-frequency fluctuations in amnestic mild cognitive impairment: a resting-state fMRI study. Neuroimage55(1), 287-295 (2011).
- Amit Y, Geman D. Shape quantization and recognition with randomized trees. Neural.Comput9(7), 1545-1588 (1997).
- Ho TK. The random subspace method for constructing decision forests. IEEE. Trans. Patt.Analy. Mach.Intellig20(8), 832-844 (1998).
- Liaw A, Wiener M. Classification and regression by random forest. R. News2(3), 18-22 (2002).
- Zang TF, Jiang TZ, Lu YL, et al.Regional homogeneity approach to fMRI data analysis. NeuroImage22(1), 394-400 (2004).
- Ho TK. Random decision forests. Proc.3rd Int. Conf. Doc.Analy.Recogn1(1), 278-282 (1995).
- Biseal B, Yetkin FZ, Haughton VM, et al.Functional connectivity in the motor cortex of resting human brain using echo-planar MRI. Magn. Reson. Med 34(4), 537-541 (1995).
- UCL Institute of Neurology, http://www.fil.ion.ucl.ac.uk/spm/
- Talairach J, Tournoux P. Co-Planar Stereotaxic Atlas of the Human Brain: 3-D Proportional System: An Approach to Cerebral Imaging.Thieme. Classics (1988).
- Mazziotta J, A Toga, A Evans, et al.A probabilistic atlas and reference system for the human brain: International Consortium for Brain Mapping (ICBM). Philos. Trans. R. Soc. Lond. B. Biol.Sci356(1412), 1293-1322 (2001).
- Song XB, Dong ZY,Long XL, et al. REST: A Toolkit for Resting-State Functional Magnetic Resonance Imaging Data Processing.PLoS. ONE6(9), e25031 (2011).
- FischlB,Salat DH, Busa E, et al.Whole brain segmentation: automated labeling of neuroanatomical structures in the human brain. Neuron33(3), 341-355 (2002).
- Breiman L. Random forests. Mach. Learn45(1), 5-32 (2001).